Our newly introduced service baseline settings allow you to adapt alerting based on your own needs and according to each service's criticality.
We’re happy to announce that with Dynatrace version 1.189, you can give your baselining routines more time to evaluate short-lived performance conditions. This avoids annoying false-positive alerts on short spikes while still alerting you to conditions that require your attention. Read on for an example and description of our new baselining functionality.
What do stock markets and monitoring alerts have in common?
Hint 1: There comes a point in time when a decision must be made.
Hint 2: In retrospect, it’s easy to see if you should have bought or sold (i.e., been alerted or not).
While stock market decisions are based on market observation, alerts and decisions in software monitoring are mostly based on learned baselines. Both in stock markets and in software monitoring, the observation period and the point at which decisions are made are crucial.
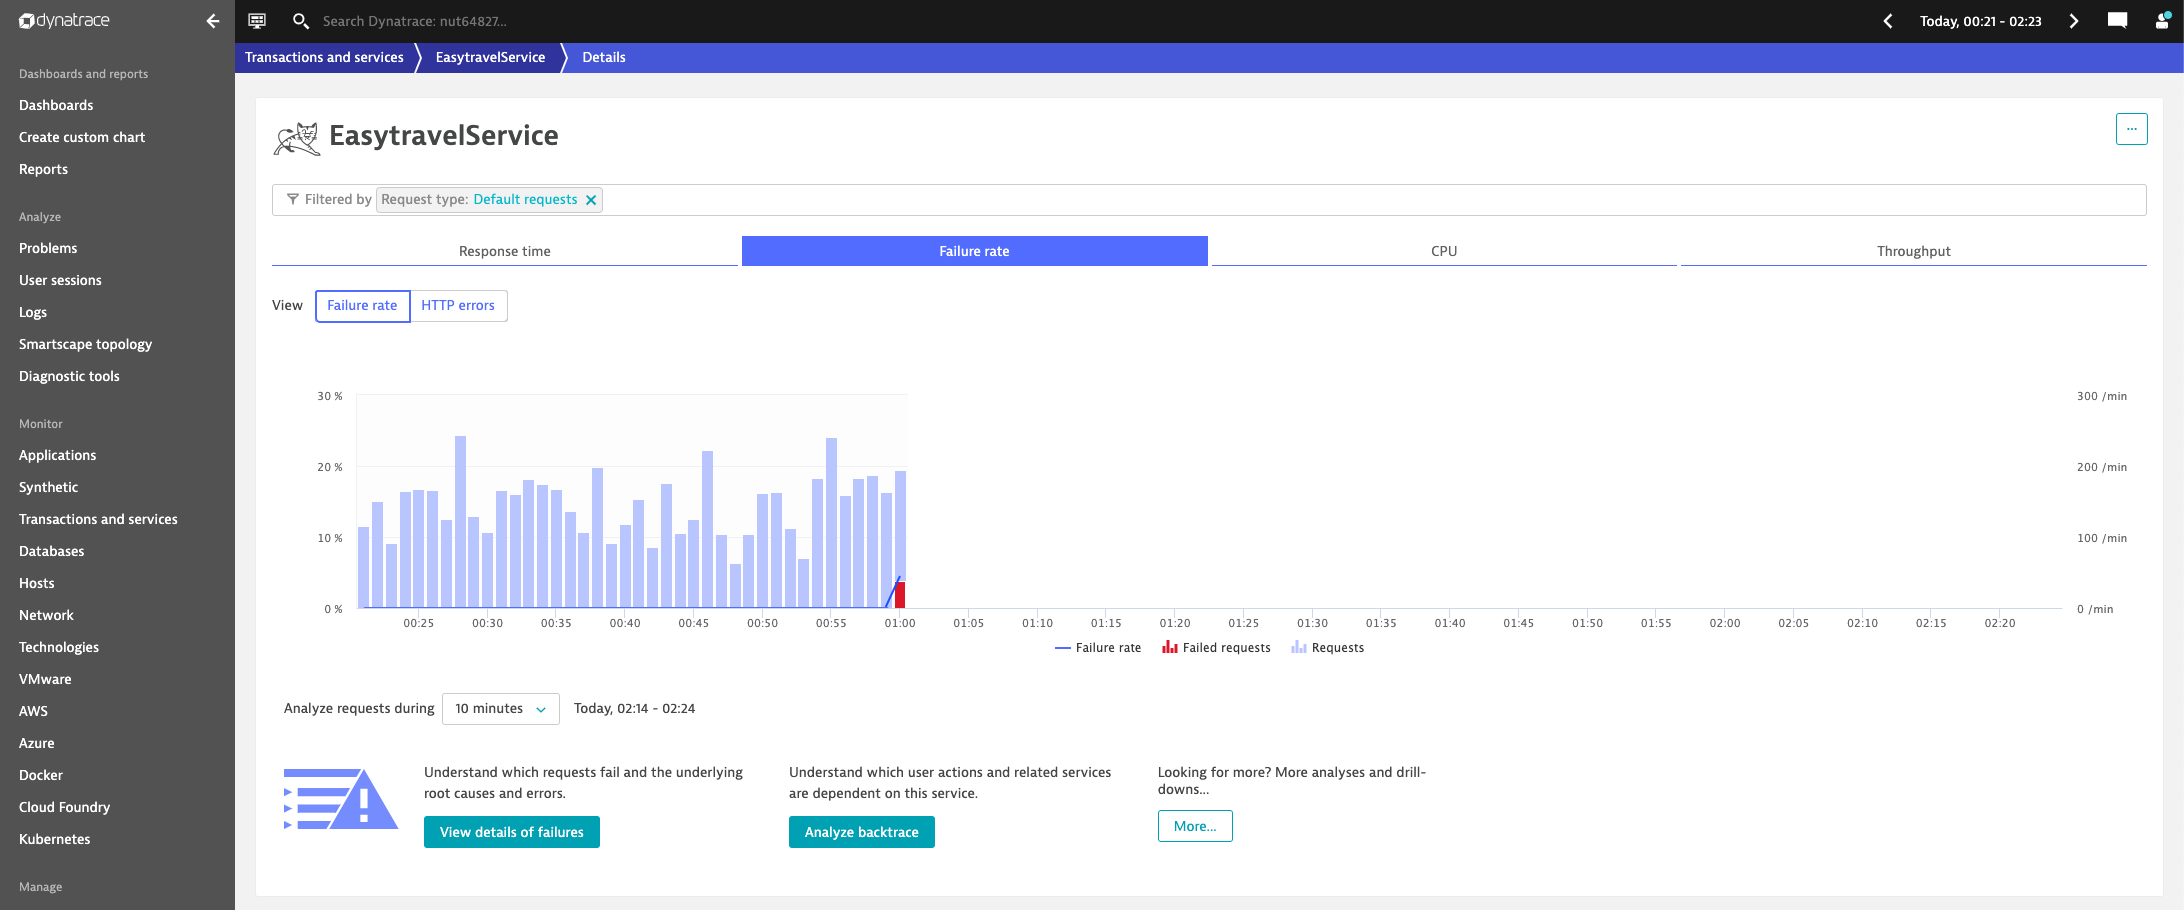
How does a longer observation period help avoid false-positive service-baseline alerts? The screenshot below shows a monitored service that suddenly experiences a much higher error rate compared to the learned baseline.
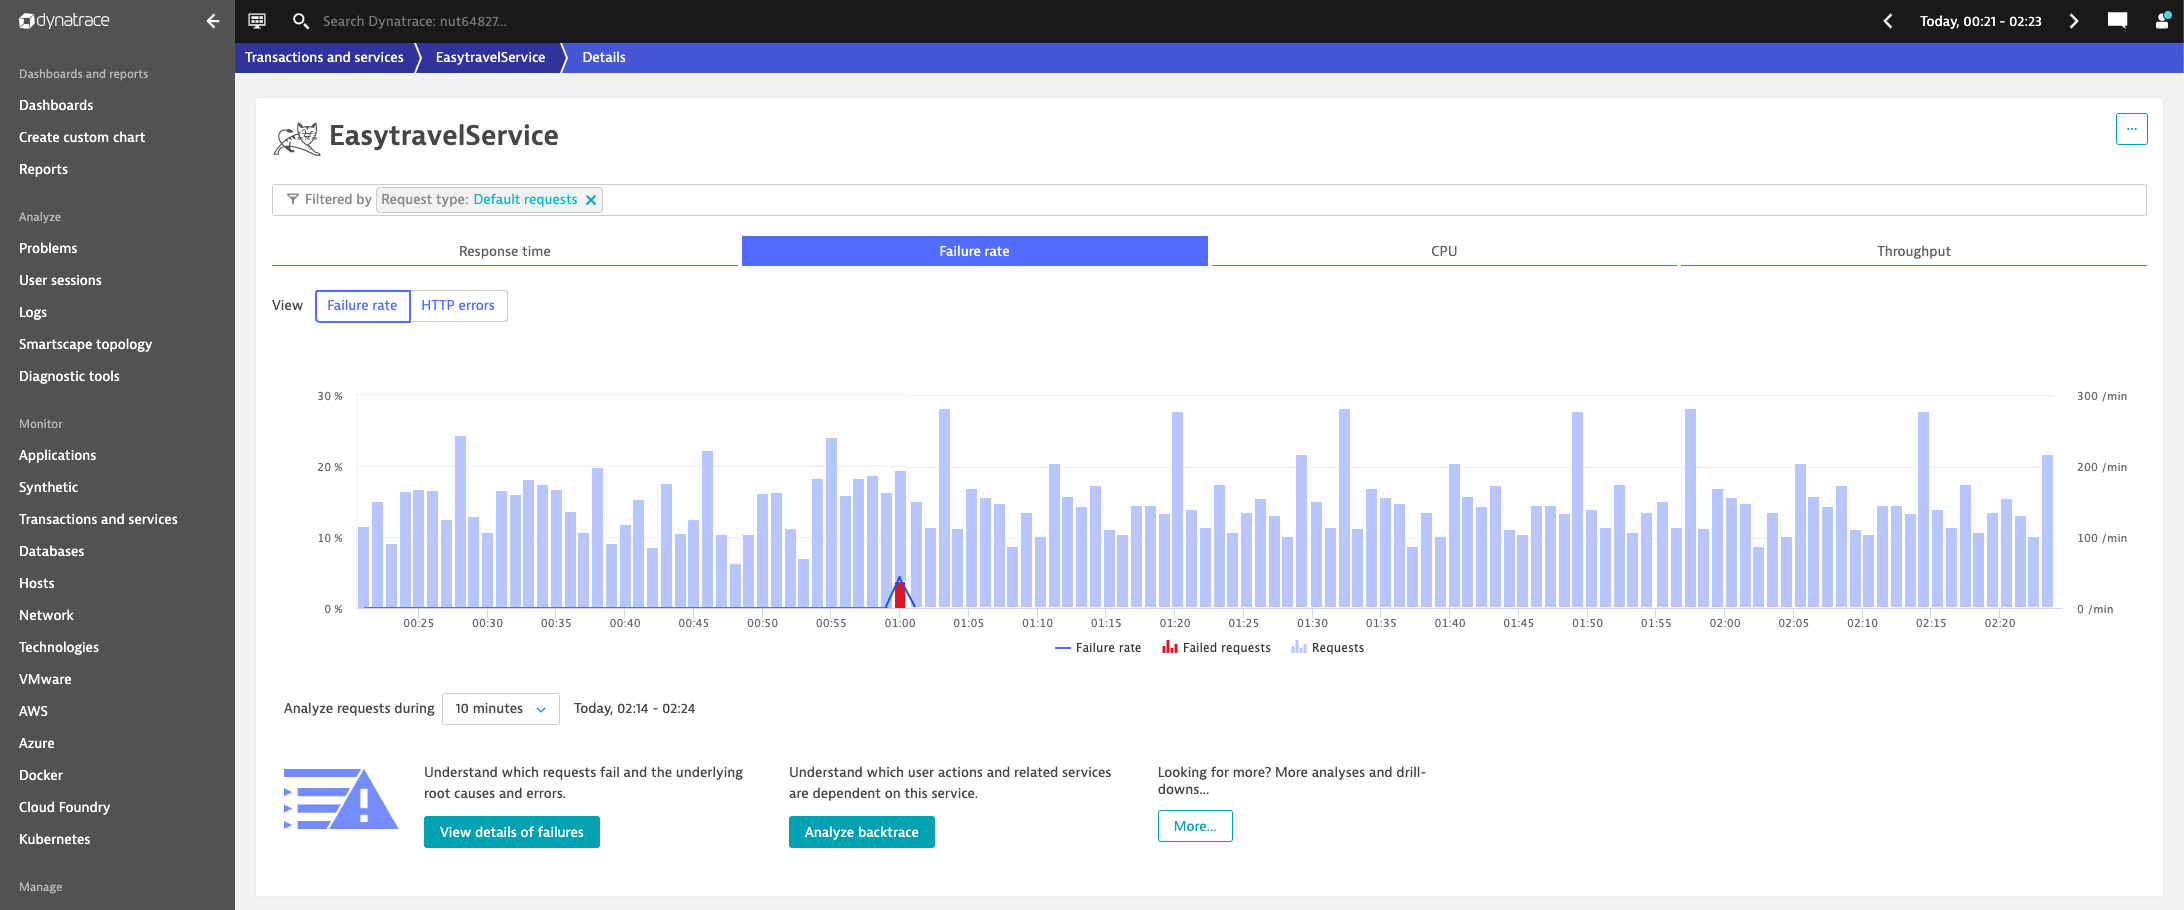
Imagine that you need to make a decision as to whether you need to wake the Ops team in the middle of the night. Let’s say that you decide to wait another five minutes to monitor the situation. Waiting an additional five minutes reveals that the issue was just a short hiccup caused by a client that used an outdated service parameter. The situation quickly settles back into the learned baseline, as shown below:
As you can see, efficient monitoring is a matter of balance between quick reaction when necessary and avoiding overreacting to short hiccups.
Give your baselining more observation time to avoid false positives
Dynatrace monitors all your services with an out-of-the-box automatic baseline, which immediately learns each service’s typical behavior and alerts on abnormal situations. The automatic-baseline approach has many benefits, such as immediate insights into all dynamic microservices.
Our newly introduced service baseline settings allow you to adapt alerting based on your own needs and according to each service’s criticality. By default, Dynatrace service baselining evaluates the criticality of each situation by taking into account statistical confidence within one to five-minute intervals. This means that Dynatrace alerts more quickly when an error spike occurs in a high-traffic service (compared to a low-traffic service where statistical confidence is lower).
But it’s difficult, or even impossible, for Dynatrace to automatically detect how critical a service is to the success of your digital business. While you might want to wait a bit longer before alerts are sent out for non-critical, low-load services, you might want to receive immediate alerts for changes in the performance of your most critical services, even if you know that such alerts have a high rate of false positives.
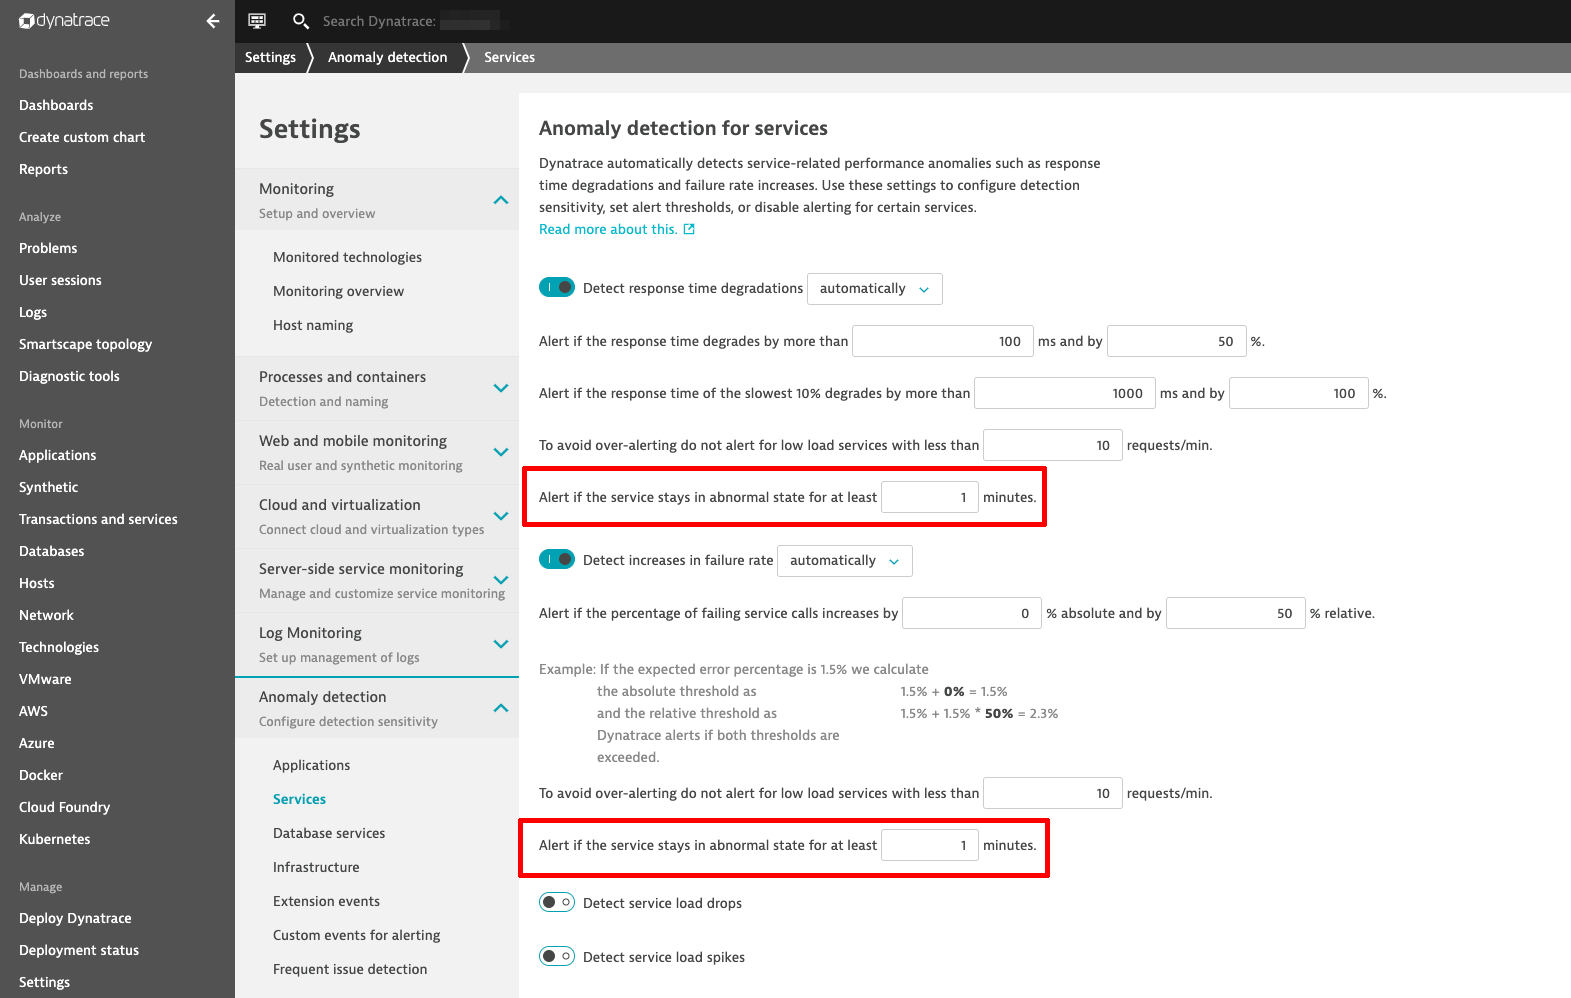
See the Anomaly detection for services baseline configuration settings page below where we’ve added two new settings:
Here are some pointers on using the new settings:
- By default, the minimum observation period in Dynatrace is one minute. To avoid false-positive alerts on your services, you can add more time.
- By setting the configuration to 15 minutes globally for all your services, you can avoid false-positive alerts on short spikes.
- The configuration is available at the global level as well as the service level. This allows you to override global settings with a stricter setting for critical services.
- This setting distinguishes between slowdown alerts and error detection, so that you can choose an individual strategy for each.
Close issues sooner with shorter event timeouts
If a problem has a long timeout (the time a problem stays open before being dismissed), for example, 15 minutes, in a low-traffic situation, you can’t really suppress short spikes because all spikes will be reported as 15-minute duration problems.
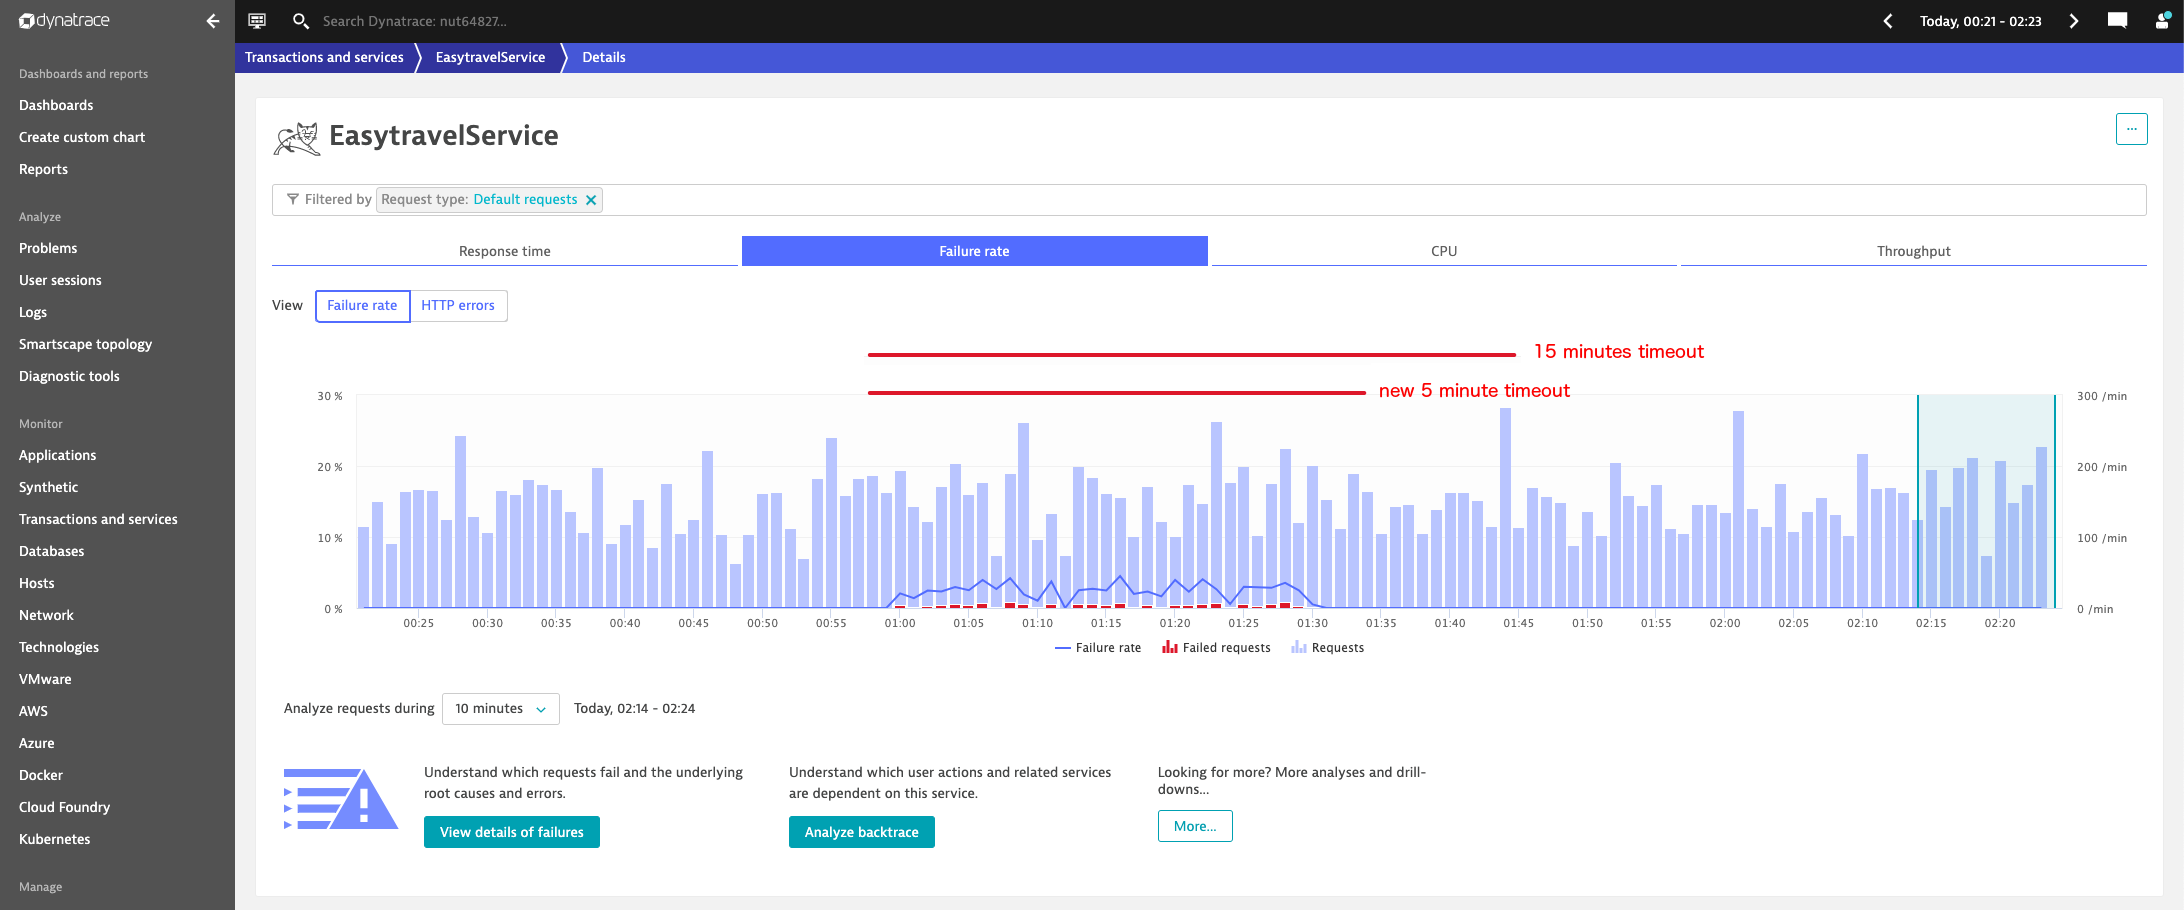
To improve this, in the latest release, we’ve reduced the default timeout for low-load events from 15 minutes down to 5 minutes. The rationale behind this is that low-load events may consist of no more than a handful or errors at best; so it makes sense to reduce the problem timeout. As a result, you’ll no longer see low-load events that are kept open for more than five minutes following any detected spike. The reason for having a timeout period at all is to avoid reopening events when multiple spikes follow in sequence.
The screenshot below illustrates the timeout reduction for better understanding:
Summary
Efficient monitoring takes place when you can maintain a balance between quick alerting on critical situations and eliminating false positives.
It might sound simple, but it’s tremendously tricky to distinguish between a critical service alert and a false-positive situation. Increasing the observation window can significantly reduce alert spam on all your non-critical services, while preserving quick alerts for a handful of highly critical services.
Just like in the stock market where you need to make the decision to buy or sell in a falling market, the decision must be made at a single point in time. Having the option to observe the market for an extra day or week makes it easier to see when the decision should be made.


Looking for answers?
Start a new discussion or ask for help in our Q&A forum.
Go to forum