Application and transaction-driven KPIs are at the heart of any successful business. Well-defined metrics for your applications and microservices are also at the heart of any technical analysis.
As the owner of a ride-hailing company, for example, you might have questions like “How many active drivers do we have per region?”, “What’s their average ride distance?”, or “Which are the most popular destinations?” Also, you’d probably like to be alerted of significant anomalies. In an existing application landscape, however, it can be difficult to get to those metrics.
Here’s how Dynatrace customers do it
Dynatrace customers have the ability to leverage PurePath distributed tracing functionality in driving adhoc multidimensional analysis (MDA) on any kind of data available within their microservices. This functionality has been hugely successful with our customers, and they have come up with many intriguing use cases for it:
- An international hotel group is using it to investigate the influence of specific loyalty program offers on the number of bookings.
- A ride-hailing company is using it to quickly identify anomalies in the number of bookings per geographic region.
- A multinational travel agency uses it to make sure that premium customers have a perfect software experience by diagnosing error rates per loyalty status.
- A large manufacturing company is using it to track their error rates by production site.
- A larger financial institution is using the analysis to report business metrics on dashboards and make them accessible via the Dynatrace API.
Optimize your application and business performance by analyzing request- and service-based metrics
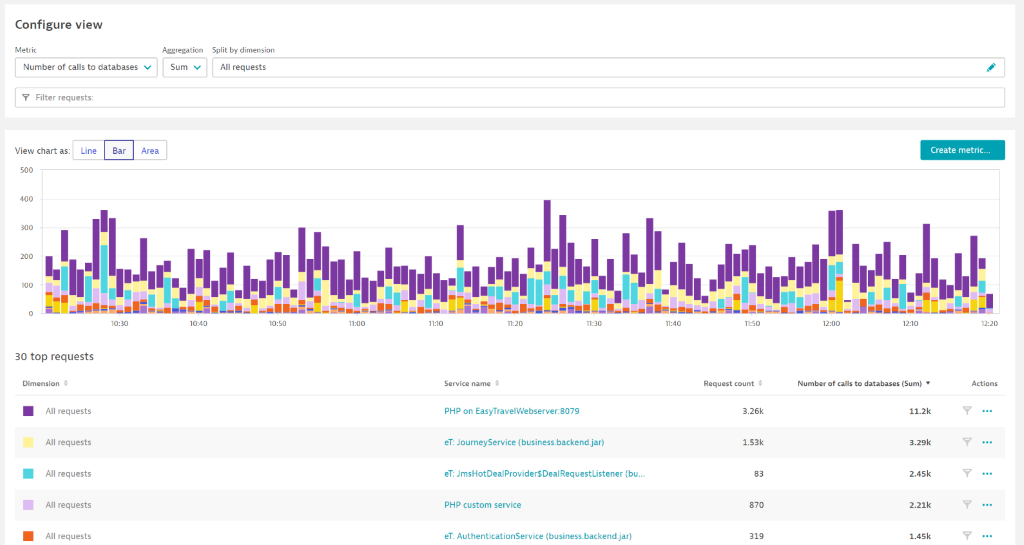
To take the multidimensional analysis feature to the next level, we seamlessly combined it with our Calculated metrics capability. This new functionality completely replaces the old multidimensional analysis and gives you a nearly limitless range of options for analyzing, charting, and reporting on your most important pages and use cases.
- Create the metric you need directly in the improved WYSIWYG multidimensional analysis editor with the click of a button
- Identify poorly performing services by running multidimensional analysis across services
- Analyze only services that matter by filtering them by service tags, a management zone, or a request attribute
- Make sure you have the relevant custom metrics at your fingertips and be alerted on them by pinning them to your Dynatrace dashboard with a single click
- Extend the automation along your delivery pipeline by exposing the metrics via the Dynatrace API
- Save yourself a lot of time by letting Dynatrace Davis® AI seamlessly and automatically analyze them during the root cause analysis of a problem.
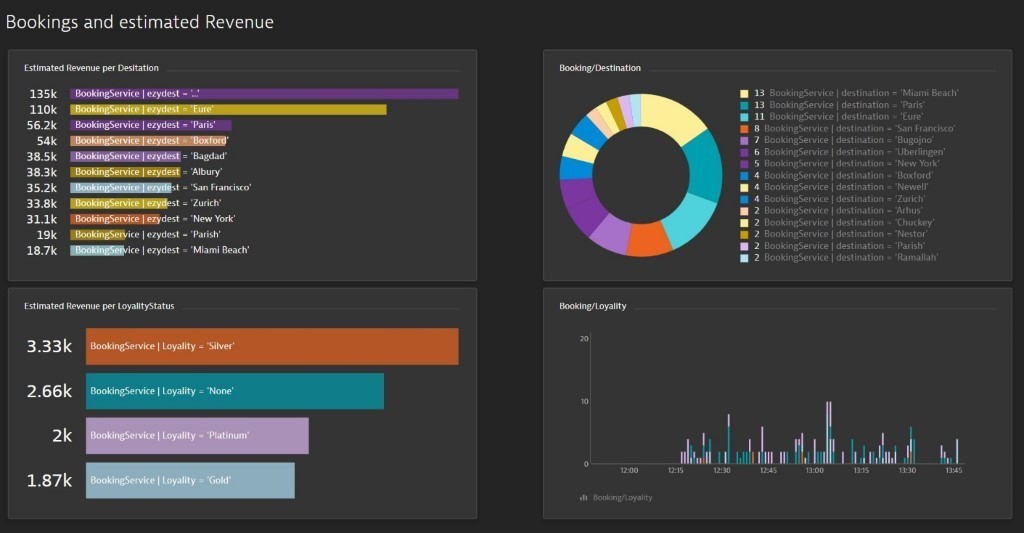
The example below shows how a travel agency charts the revenue trends of their most popular travel destinations and by loyalty status.

Important to know
What will happen with my old, saved multidimensional analysis views?
As the original multidimensional analysis view enabled you to save these views, you can reuse them over and over again. Most of these will be automatically migrated into the new multidimensional analysis.
Why are there no secondary metrics in the new MDA?
A keen eye might have noticed that the new MDA only allows for one metric. We believe that this is okay because our analysis showed that most saved views used the number of requests as the second metric. As you can see, the new MDA always shows the request count as a secondary metric to cover for this. We’re also working on adding a simple feature to show the request count optionally as a second axis in the chart.

What happens with my saved MDAs that contain two metrics if neither metric is a request count?
Saved MDAs that contain two metrics, where neither metric is a request count, haven’t been migrated and can still be used in the old view. They can however no longer be edited.
There are a few other features still missing that might prevent migration, we are working hard on all of those.
How will the new multidimensional analysis be licensed?
All functionality related to the new multidimensional analysis can be used free of charge. Calculated metrics, once created, are subject to custom metrics license consumption.
Stay tuned for parts 2 and 3 of this blog series
As there is a lot of information here to unpack, in the coming days we’ll look at the revamped Multidimensional analysis in more detail. Stay tuned for:
- Part 2 gives you a more detailed walkthrough of the new Multidimensional analysis by presenting a business use case
- Part 3, where we’ll discuss Calculated service metrics by showing off a more advanced technical use case.


Looking for answers?
Start a new discussion or ask for help in our Q&A forum.
Go to forum