To enhance your customers’ digital experiences, you need to see your application through their eyes. Every single click your end users make while using your application provides valuable insights into how well your application is performing and meeting your customers’ needs. With Dynatrace user session queries, you can analyze every single click that your customers make and get insights into how each of your users experiences your application.
We’re happy to announce additional improvements to User session queries—these will provide you with even more meaningful analytics, help you widen your USQL usage, and support many more use cases.
Search user sessions based on specific patterns with the LIKE function and wildcards
There are situations where you quickly want to see data based on a particular pattern. This pattern might be a user’s name, email address, part of their email address, or just part of a string—a sequence of code behind the user’s activity. With our new LIKE function, you can compare data with an expression using wildcard characters to match the specified pattern. You can use the following characters:
%: Matches any string of 0 or more characters.*: Matches any string of 0 or more characters.?: Matches any single character.
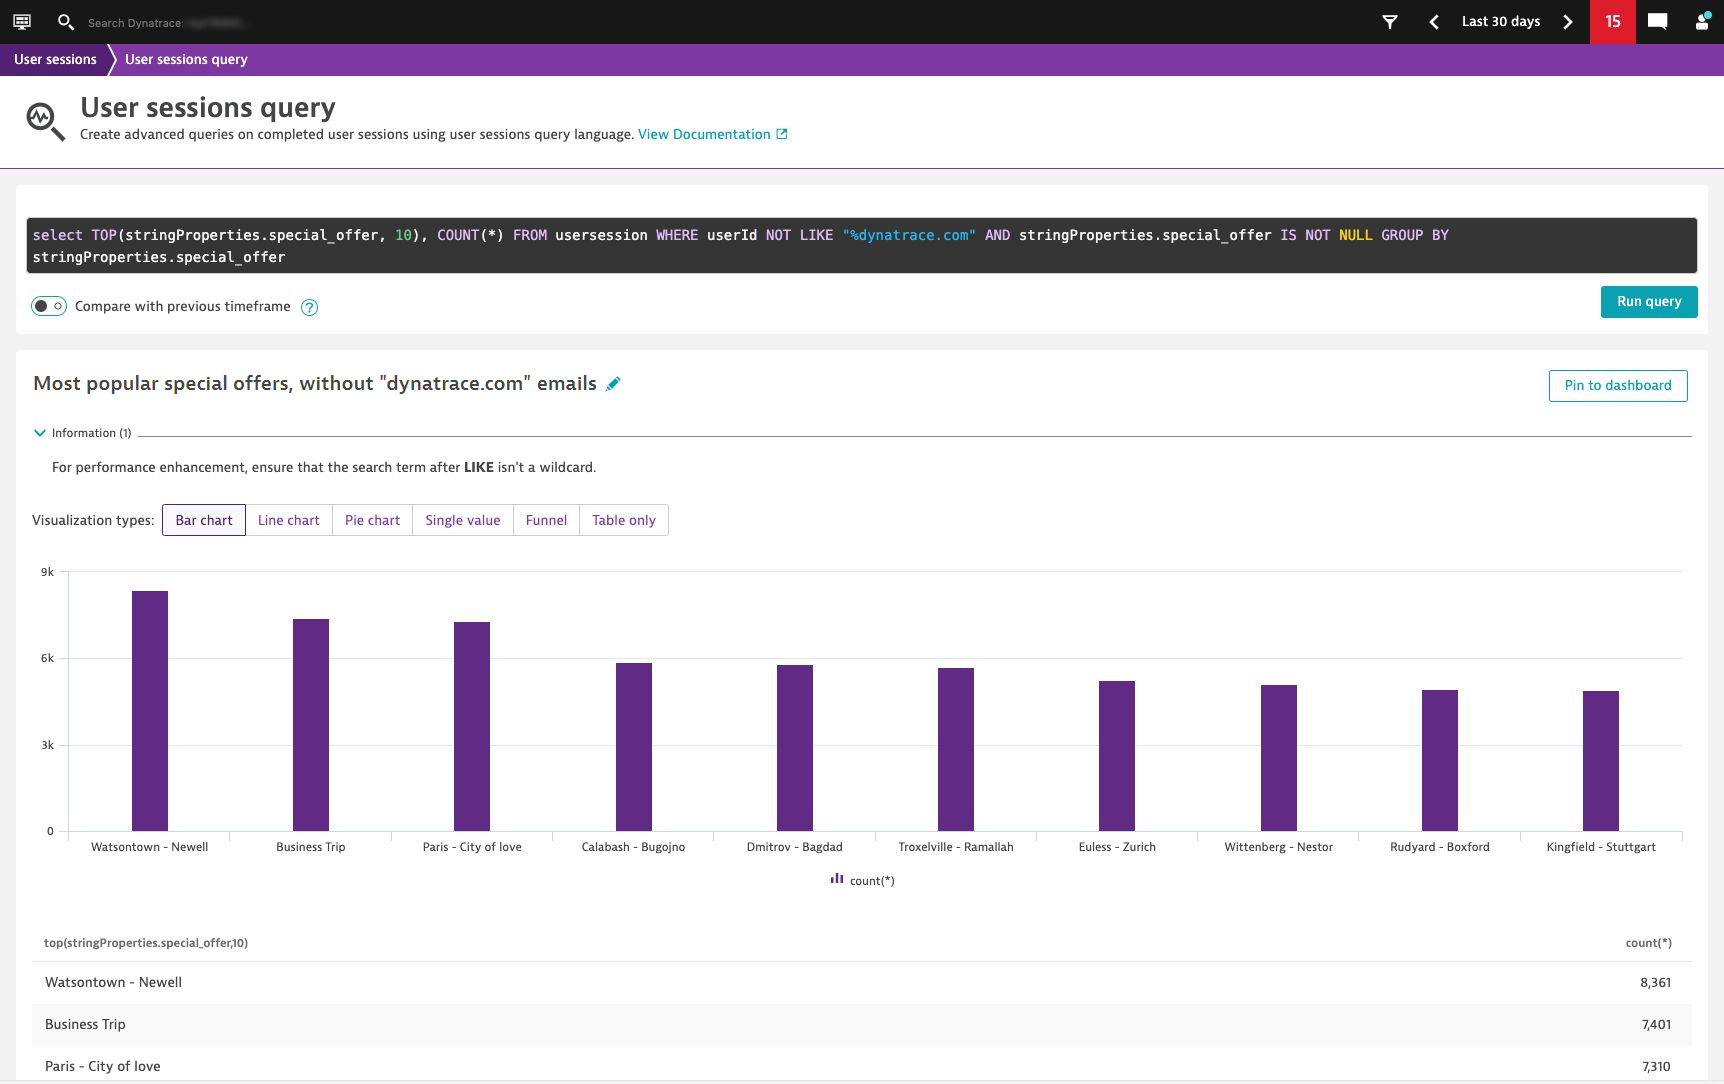
In the following example, we find out which of the special offers of our travel booking application is the most popular. To do this, we filter out all dynatrace.com emails using the LIKE function.
With all dynatrace.com email addresses filtered out, you can see that the most booked special offer during the last 30 days is Watsontown – Newell, with 8,361 bookings.
Note: String values are case-sensitive. For instance, the query SELECT city FROM usersession WHERE userId LIKE "%dynatrace% will match me@dynatrace.com but not me@dynaTrace.com. To override this, use the ? wildcard character: SELECT city FROM usersession WHERE userId LIKE "*dyna?race*"
Identify (and visually replay) user session errors within specific user segments
Until now, your options for using USQL were somewhat limited if you wanted to query error types. Now, however, the new user error table helps you extract different error types of user sessions.
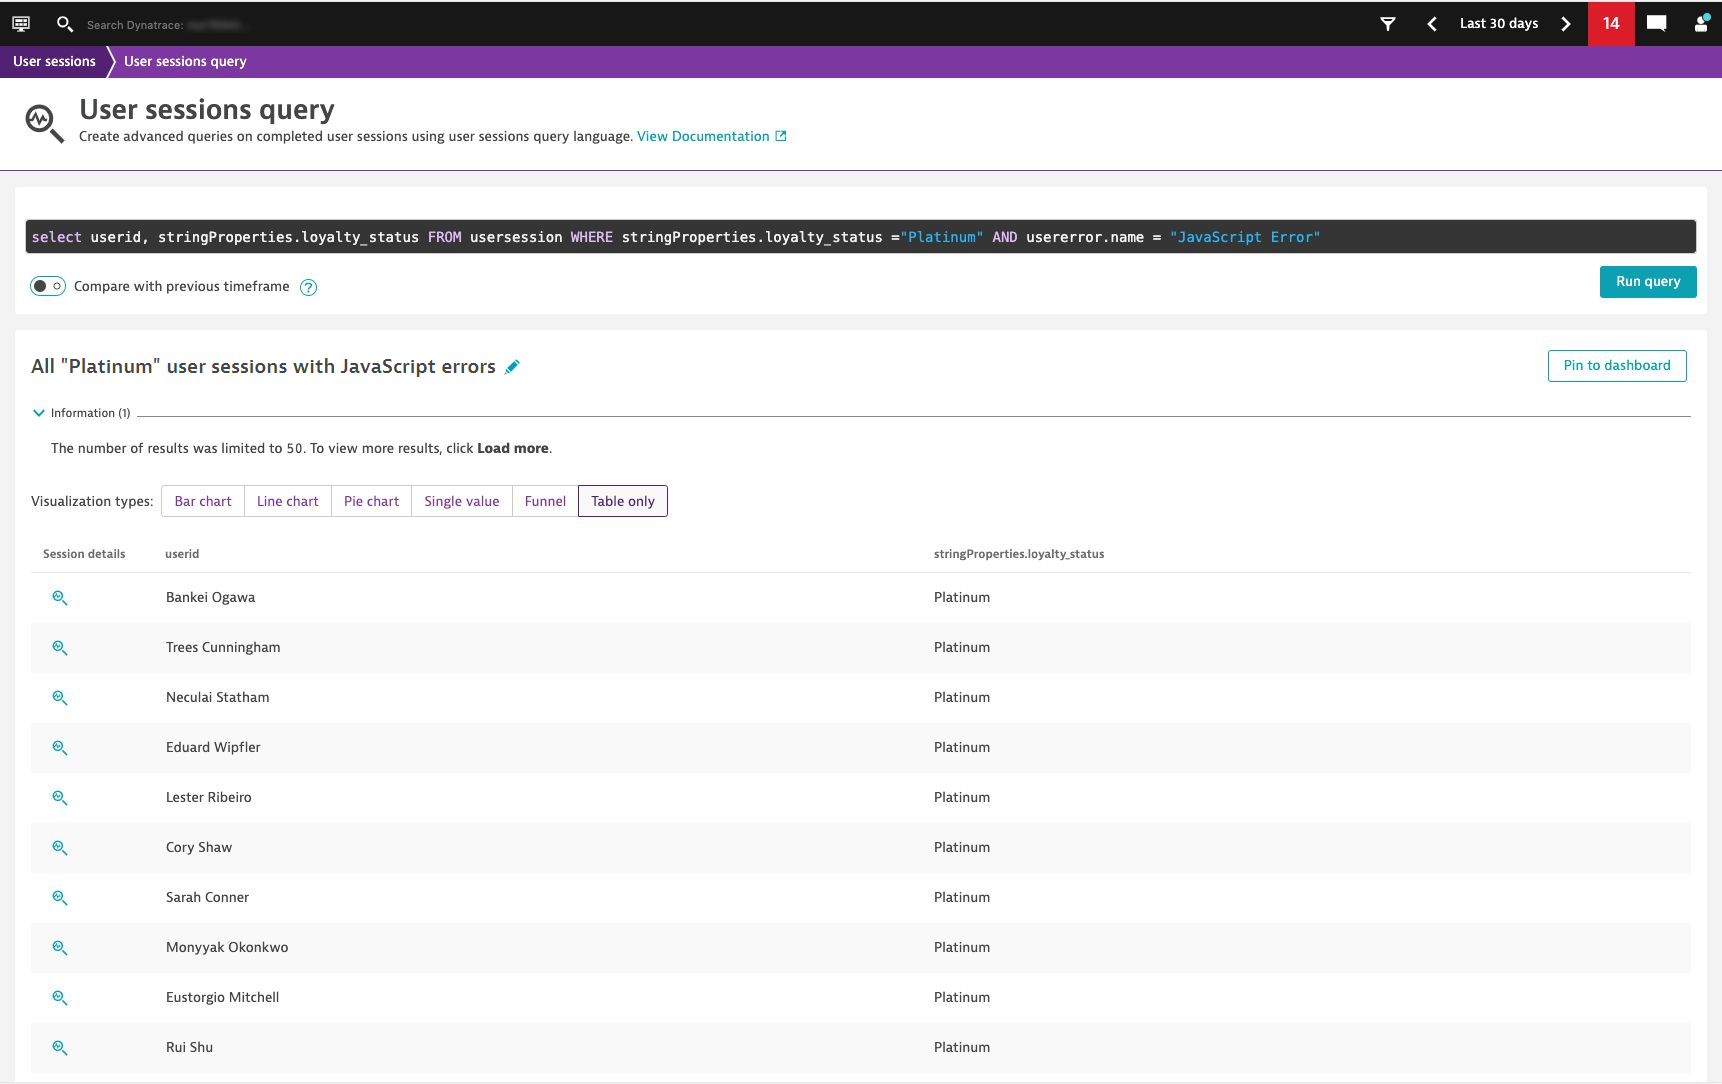
In the following example, we’re querying all our Platinum users’ sessions to see which ones had JavaScript errors.
By selecting the link to the left of the user ID, you can now review the entire user session using Dynatrace Session replay to visually replay your users’ complete digital experience and identify errors that should be fixed immediately.
See exactly how your end users experience your application with the new PERCENTILE function
When you launch your application in a new region, you probably want to know how your users in that region experience it. Here it’s good to remember that averages don’t cover 99% of your customers’ user experience. Instead of measuring the average response time, you might want to know how fast your application performs for customers who receive the slowest response times. You can now see this information with our new PERCENTILE function.
A percentile represents a value below which there’s a percentage of data points lower in value. For example, the median is the 50th percentile—the point in the data where 50% of values fall below this value and 50% are above it. A frequently used percentile is the 99th percentile, which means that 99% of the values fall below this value.
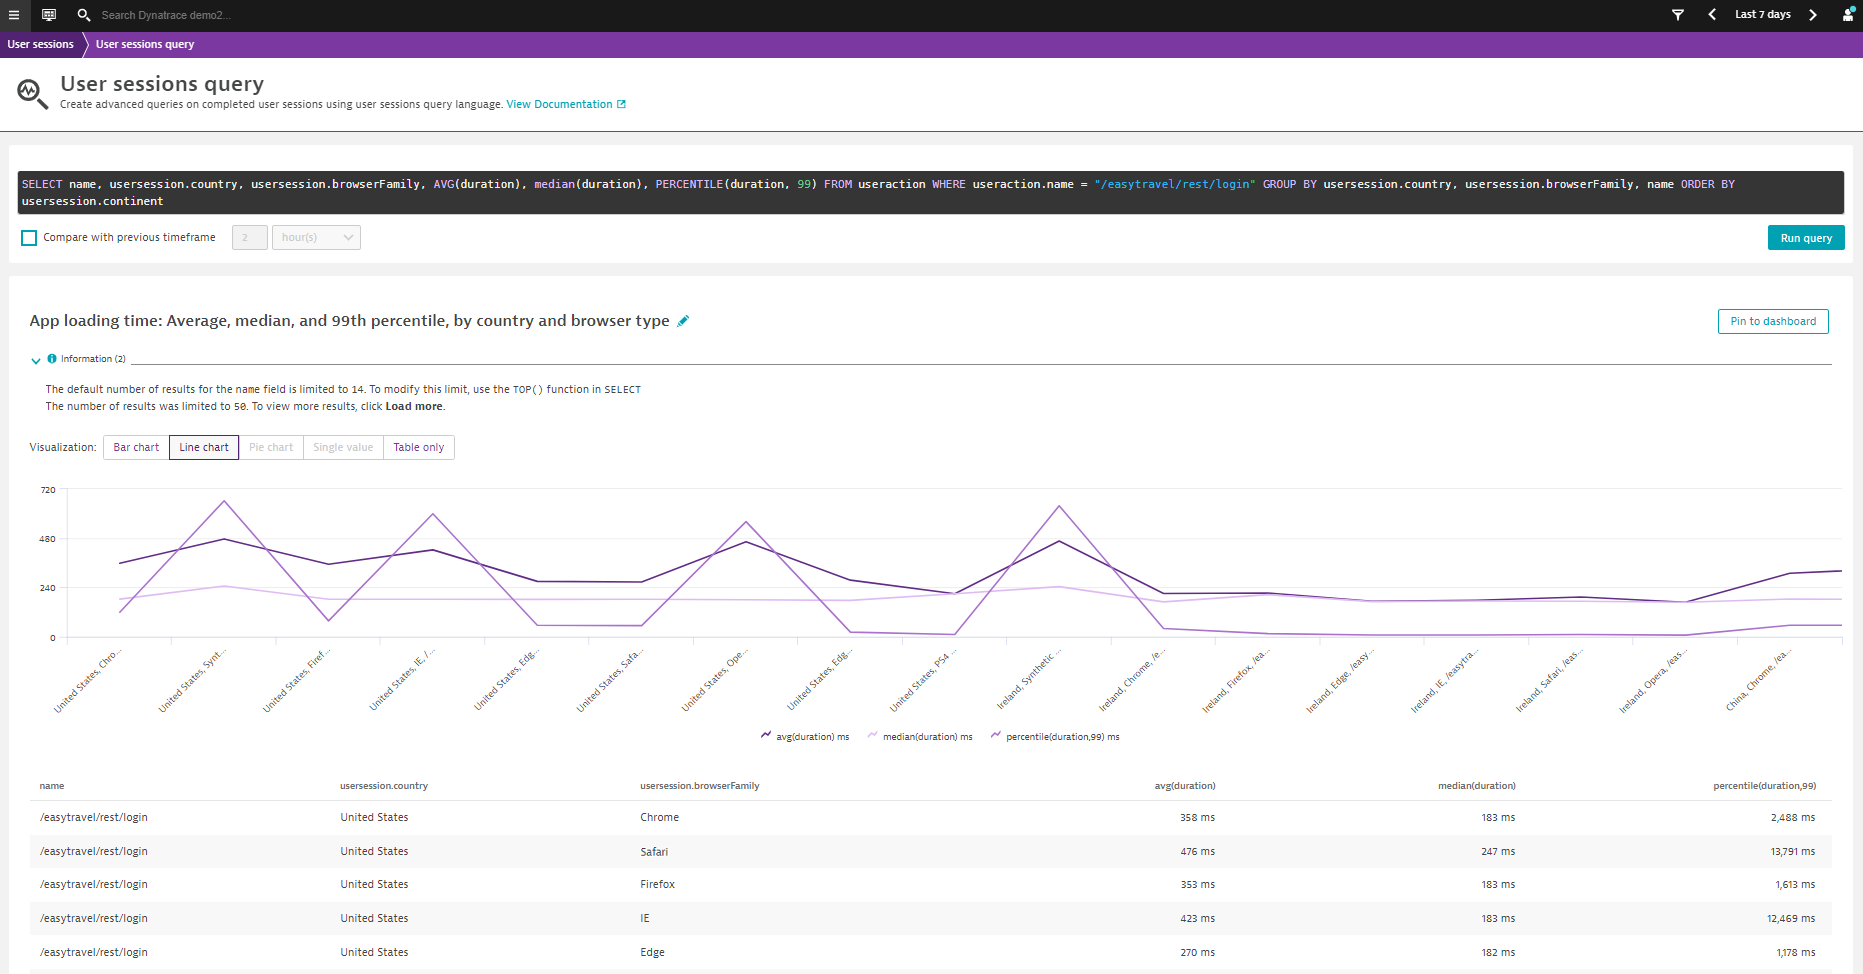
Let’s see how long it takes your customers to call your application by country and browser type, and compare the average, median, and 99th percentile values.
When looking just at the average or the median duration, you might think that all browsers behave quite similarly. The maximum delta is around 200 ms, and all the durations are way below the dreaded 1000 ms level.
Looking at the 99th percentile however, you see a completely different picture. First, note that for 99% of your users, page load duration is at least 1100 ms. This is hugely different from the 300–400 ms we saw for the other values. Looking at the median, you might be tempted to think that Safari and IE are as fast as the other browsers. However, looking at the 99th percentile, Safari and IE are more than 10 seconds behind the other browsers.
This information is crucial when you’re planning to penetrate new markets or regions, or launch geo-targeted marketing campaigns. If your application is slower when accessed from a targeted geography, you can start working on a remediation plan prior to launching your marketing campaign and before you drive additional traffic to the application.
Quickly find your most popular applications with the FILTER function
How many applications do you have? Fifty, one hundred, over five hundred? You might have a hard time displaying specific results from aggregations. For example, you might want to quickly see which of your applications bring the most value.
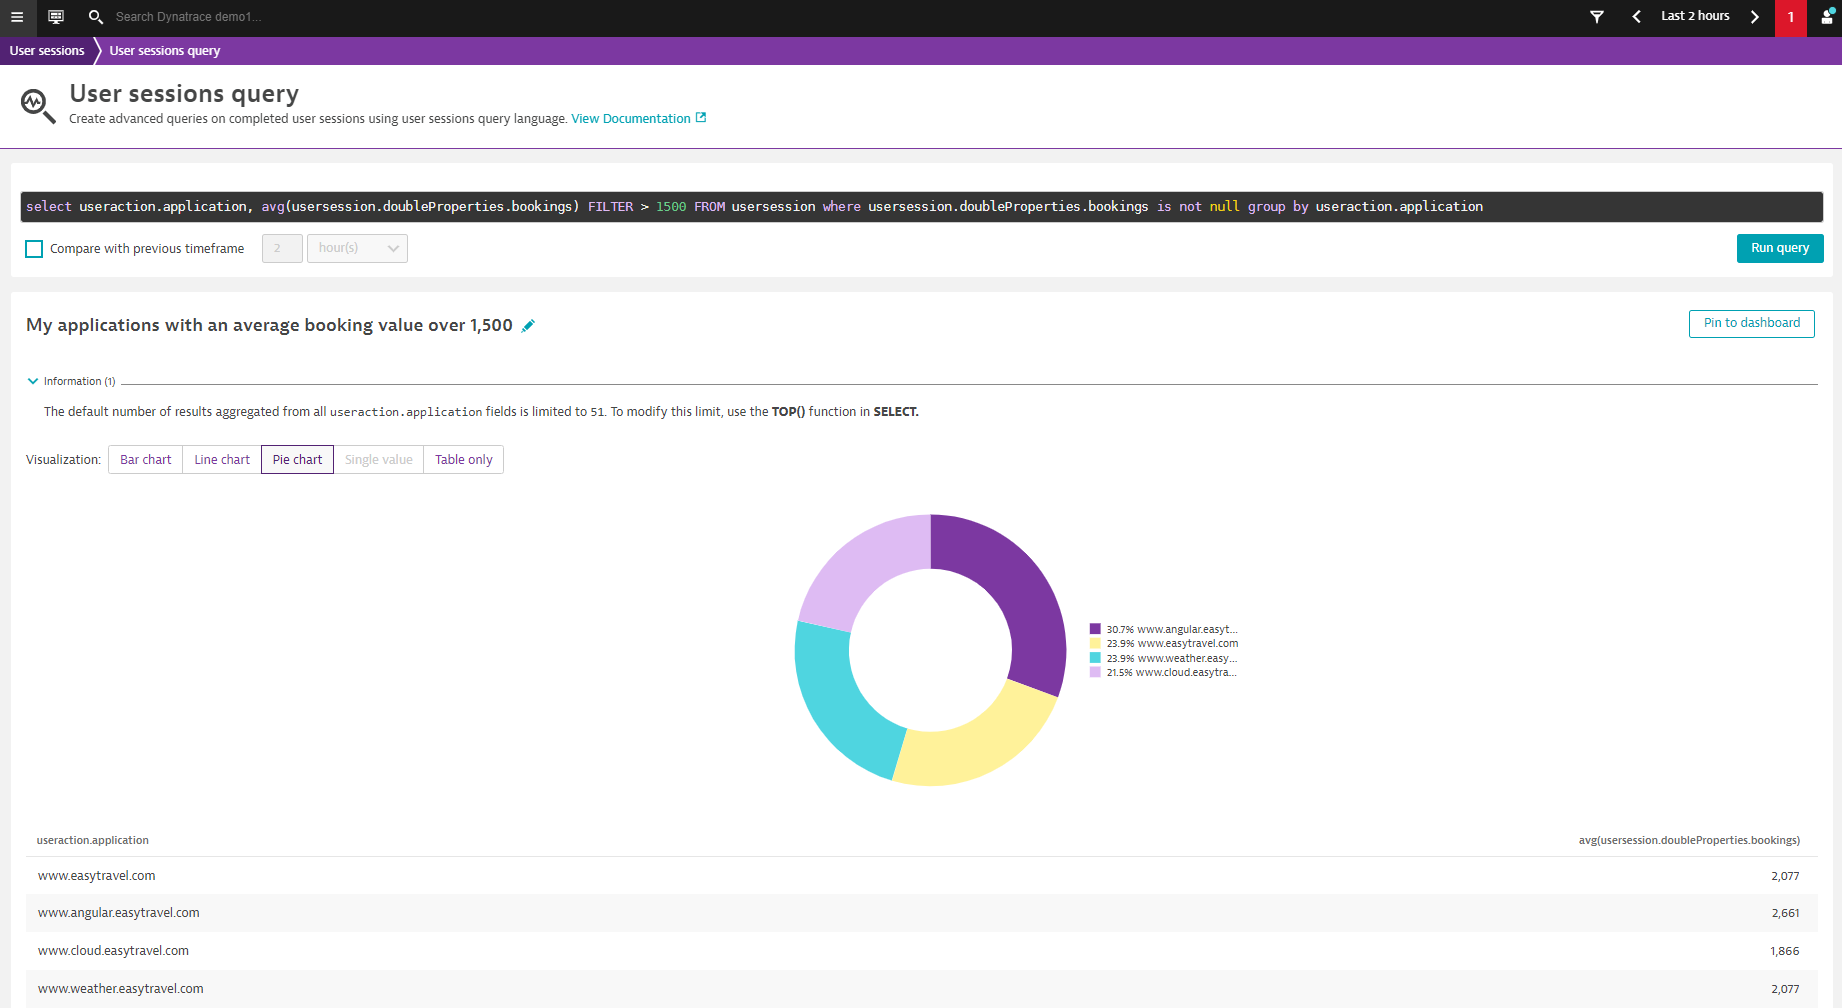
In our newest release, you can filter for functions that have numeric values, quickly displaying only specific results from aggregations. Here we query Dynatrace to show all applications that have an average booking value over 1,500.
Please note the difference between the WHERE and the FILTER functions: While you can use the WHERE clause only on absolute values, the FILTER function works on aggregated values as well.
Basic mathematical operations supported in certain fields
With this release, you can also perform basic mathematical operations with certain fields. Supported operators are addition (+), subtraction (–), division (/), multiplication (*), remainder (%), and modulo (MOD). You can use these operations to modify numerical values and display them in different units of measurement. For example, duration, which is stored in milliseconds, can now be displayed in minutes or hours.
What’s next?
Your enthusiastic response to User sessions queries encourages us to make it stronger and better. We have loads of new features in the pipeline that will help you make the best of User sessions queries, so please stay tuned!


Looking for answers?
Start a new discussion or ask for help in our Q&A forum.
Go to forum