As the popularity of microservices architecture increases, more teams are getting involved with the delivery of individual product features. It’s not uncommon to see different teams use different monitoring solutions to monitor different features—this makes it a real challenge to achieve end-to-end visibility of application requests.
The W3C Trace Context specification defines a unified approach to context and event correlation within distributed systems, such as microservices environments. With this standard in place, end-to-end transaction tracing within distributed applications across a range of monitoring solutions will no longer be an issue. This standard also provides a smooth transition path that teams can take to the adoption of Dynatrace monitoring, one team at a time, without ever breaking end-to-end visibility.
If your teams use multiple Dynatrace environments, they can now go one step further and follow transactions from one environment to the next using cross-environment PurePaths.
Update – November 21, 2019: The standard is now in “Proposed Recommendation” status (see the official announcement). This means that the standard is complete and it’s been submitted to the W3C Advisory Council for final approval.
Get end-to-end visibility (even through unmonitored services) with W3C Trace Context support
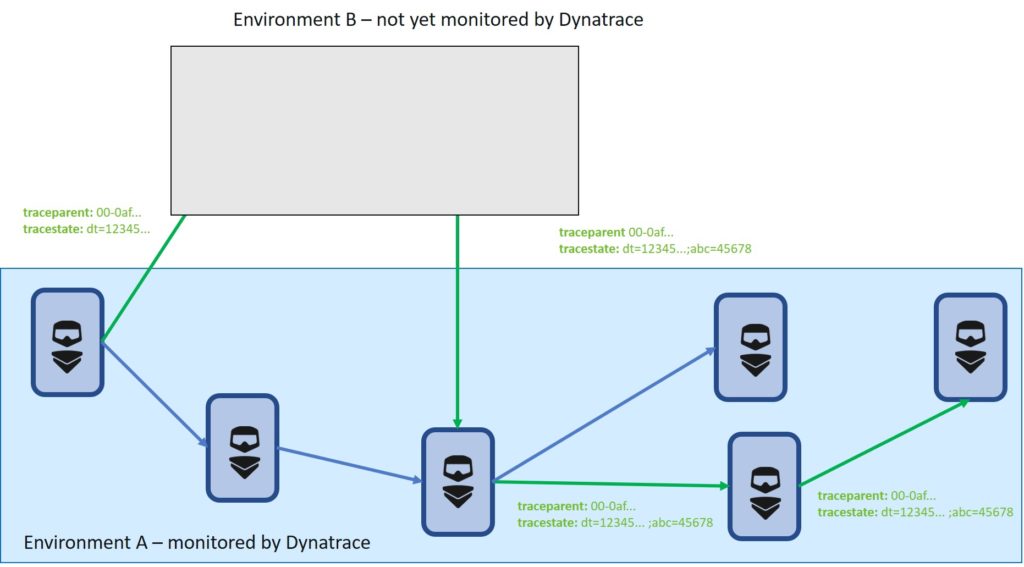
What if a team doesn’t yet use Dynatrace but has manually added instrumentation to their code using an SDK such OpenTelemetry and they use an open-source tool to help debug code across microservices, such as Jaeger? Up to now, in such a scenario, transactions would stop at the boundary of environment A (see diagram below).
Now, with support for the W3C Trace Context specification in Dynatrace, you no longer lose end-to-end visibility, even when an unmonitored service from another team is called in the middle of your transaction. This is now achievable because the same trace ID (contained in the trace parent header) is shared by all services (provided that the library that the developers use supports the new W3C Trace Context standard).

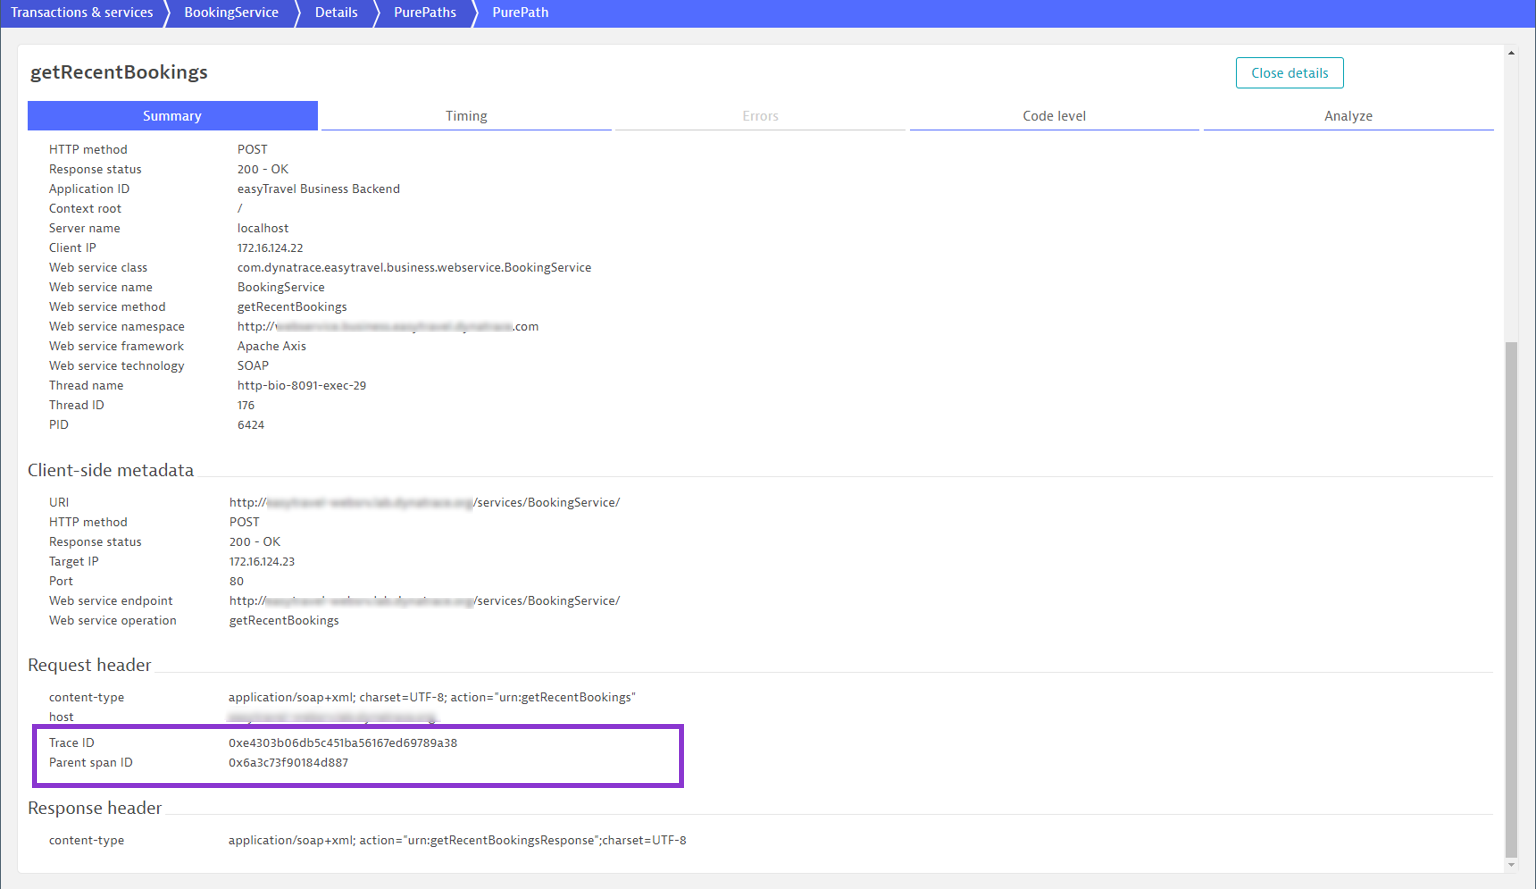
If Davis®, the Dynatrace AI causation engine, determines that unmonitored services in environment B are the root cause of an issue in Environment A, you’ll be able to look in the debugging tool used by the developers in environment B for more information about that exact transaction by referencing the trace ID that’s displayed in the PurePath details of environment A (see example below).

This allows enterprises to upgrade smoothly, one team at the time, to the Dynatrace software intelligence platform without ever breaking end-to-end visibility. To learn more, have a look at our previous blog post, which introduced W3C Context support in Dynatrace.
How can I get this feature?
- W3C Trace Context support is available as an Early Adopter Release (no registration required) beginning with Dynatrace version 1.180.
- You can enable this support in the Dynatrace web UI at Settings > Server-side service monitoring > Deep monitoring > Distributed tracing.
Follow transactions from one monitoring environment to another with cross-environmental tracing (Preview)
Before you consider using multiple Dynatrace environments, we highly recommend that you take a close look at management zones. Management zones are a powerful information-partitioning mechanism that simultaneously promotes collaboration and the sharing of relevant team-specific data while ensuring secure access controls. Also, Davis, the Dynatrace AI causation engine for automatic problem detection and root cause analysis, works hand in hand with management zones.
Using multiple Dynatrace monitoring environments might make sense if you’re looking to maintain a separate monitoring environment for each of your organization’s data centers and have a strict separation of the data. With such strict separation of data however, Davis AI would only be able to work with the data captured within a specific environment.
Imagine, for example, two completely separate organizations using Dynatrace: a bank and an inter-bank data processing center that the bank communicates with. If any issues were to occur, the bank and the inter-bank data processing center would want to be able to collaborate and solve the issues together, as quickly as possible.
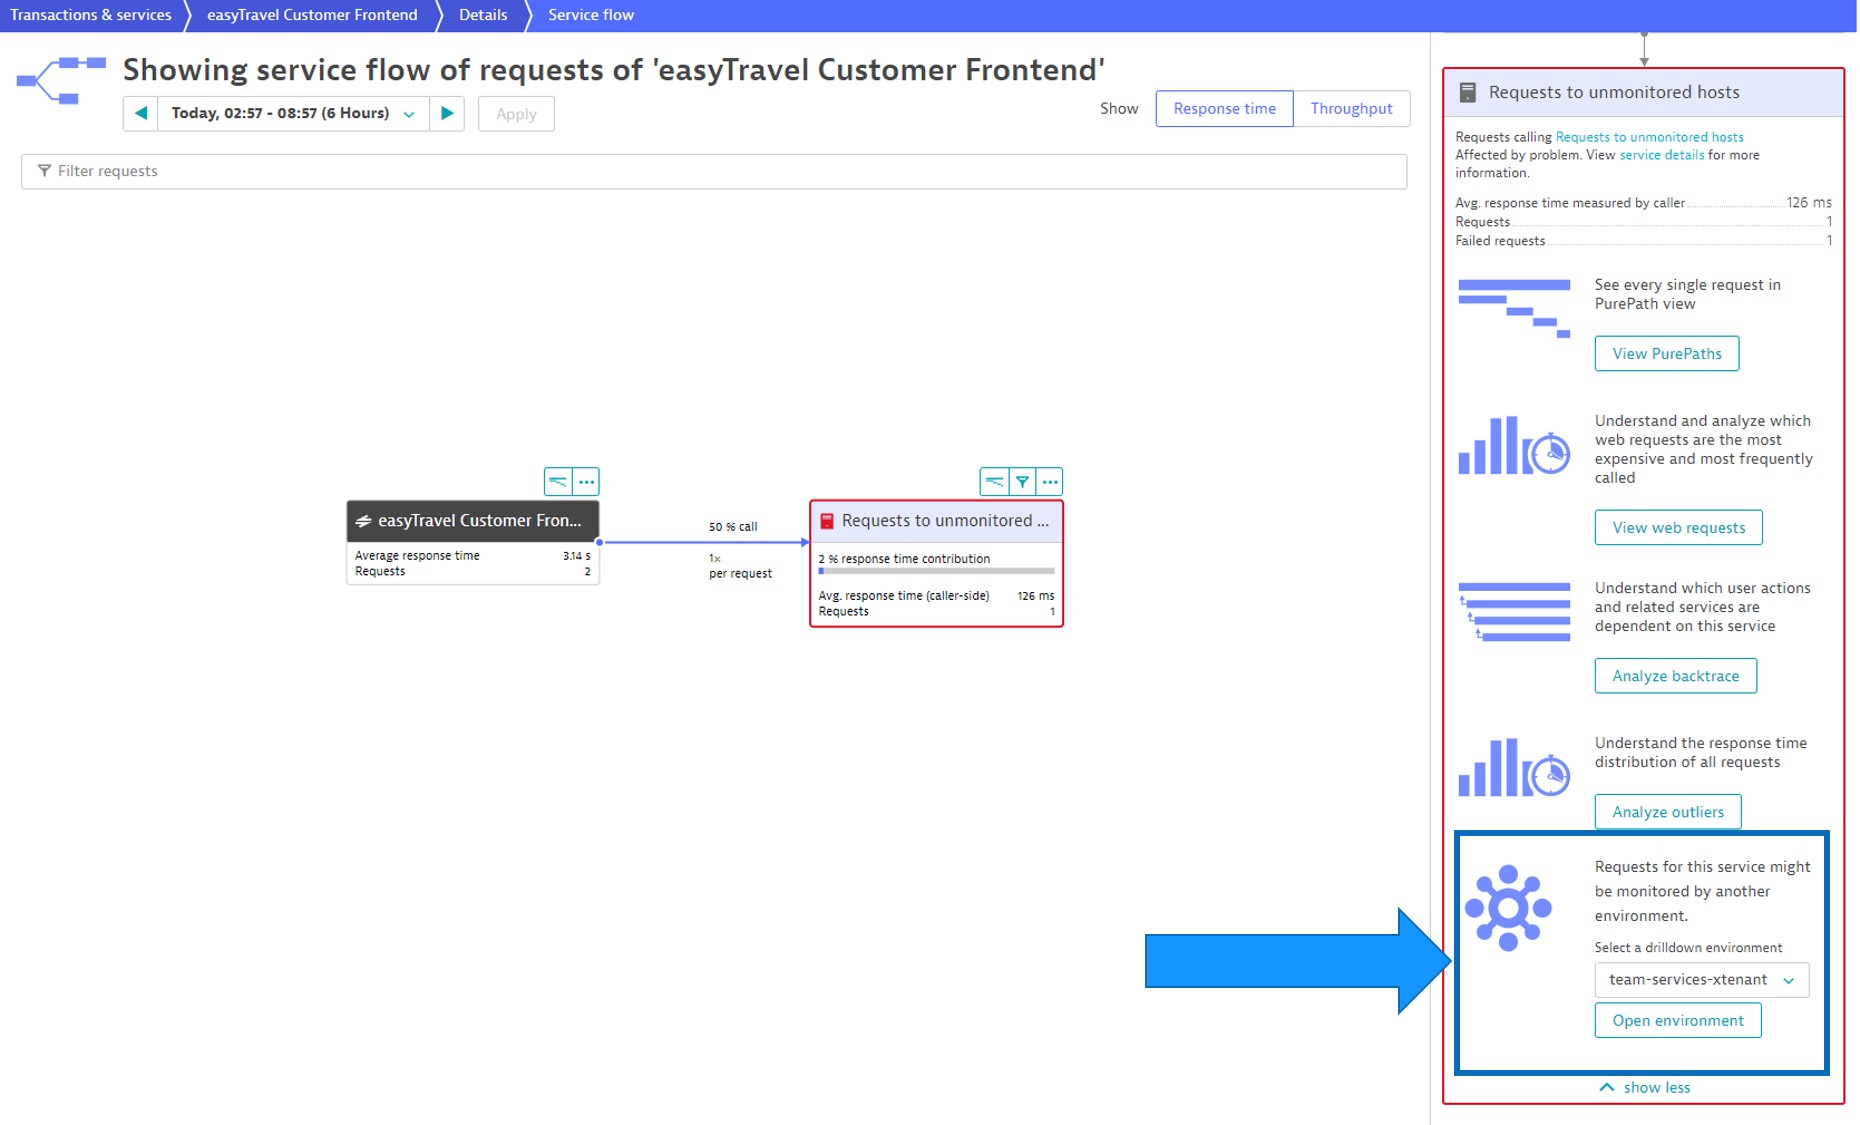
Once a connection between the two environments is set up (see the blog post about cross-environment dashboards for details), it’s possible to follow transactions from one monitoring environment to another with a simple drill-down from any service that appears in Service flow.

Similarly, you can now use the Service backtrace functionality to trace back requests that originated in another monitoring environment.

Limitations
- Dynatrace AI capabilities across environments are limited as the data available in each environment is strictly separated.
- See our Previews disclaimer.
How can I get this feature?
- Cross-environment tracing is available in a Preview (registration required!) in Dynatrace version 1.176.
- If you want to participate in the cross-environment tracing preview, please fill out the registration form.
- A connection between you two environments needs to be set up, as explained in our cross-environment dashboards blog post.


Looking for answers?
Start a new discussion or ask for help in our Q&A forum.
Go to forum