Dynatrace is a leader in Cloud monitoring, we have architected our Software Intelligence Platform specifically to complement Kubernetes by providing extensive functionality to tame the complexities and prevent performance issues that can occur across the development and deployment cycles. Based on our vast and direct experience with Microservices Kubernetes environments among our Enterprise Clients, we’d like to offer 3 monitoring pitfalls to avoid.
Organizations seeking ways to capitalize on the cloud computing delivery model also look to shorten development cycles without sacrificing superior user experience. In order to accomplish this, one of the key strategies many organizations utilize is an open-source Kubernetes environment, which helps build, deliver, and scale containerized Cloud Native applications.
Gartner’s Top Emerging Trends in Cloud Native Infrastructure Report states, “Containers and Kubernetes are becoming the foundation for building cloud-native infrastructure to improve software velocity and developer productivity”. In fact, the report goes on to speculate, “By 2022, more than 75% of global organizations will be running containerized applications in production, which is a significant increase from fewer than 30% today.”
Yet as a platform, it is in no way considered a standalone environment, containing all the functionality needed for Cloud Native development. Kubernetes was architected to allow for additional technologies and services to assist in speed, scalability and reducing the overall complexity which can arise from a Microservices environment. As Dynatrace is a leader in Cloud monitoring, we have architected our Software Intelligence Platform specifically to complement Kubernetes by providing extensive functionality to tame the complexities and prevent performance issues that can occur across the development and deployment cycles. Based on our vast and direct experience with Microservices Kubernetes environments among our enterprise customers, we’d like to offer three monitoring pitfalls to avoid.
1. Don’t underestimate complexity
Kubernetes is not monolithic. According to their website, “Kubernetes provides the building blocks for building developer platforms, but preserves user choice and flexibility where it is important”. This “choice and flexibility” leaves a lot of room for individual preference, and also means there are many areas in the platform that need to be addressed if you are to eliminate all potential blind-spots found in any containerized environment. As an example, Kubernetes does not deploy source code, nor does it have the capacity to connect application-level services. In fact, once containerized, many of these services and the source code itself is virtually invisible in a standalone Kubernetes environment. To add to this complexity, it’s “good enough” knowing if particular services are performing within specified parameters individually, since their “health” may be directly affected by other services upon which they are.

In order to eliminate these blind spots within Kubernetes environments, a robust monitoring solution is needed that can scale across the entire Enterprise. The Dynatrace Software Intelligence Platform gives you this full-stack visibility; from the Back-end, across the application layer and even down to the User Experience. Not only that, Dynatrace goes further; identifying and mapping all dependencies between services, giving you the full spectrum of Observability across logs, metrics, and distributed traces; even down to the code level.
2. Stand-alone observability won’t cut it
The concept of Observability isn’t new to monitoring; in a nutshell, it is the state or ability for a system to send information that can be collected and interpreted to understand its overall health or performance. Today, most thought-leaders break down Observability into three pillars: metrics, distributed traces, and logs. Let’s go into a bit of detail on each pillar and the extended Observability Dynatrace provides:
Metrics:
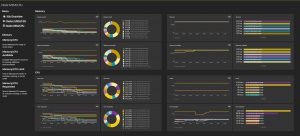
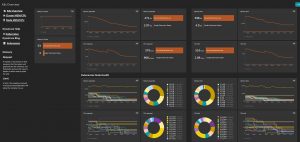
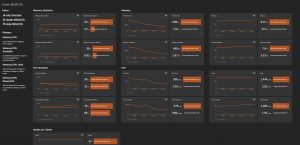
Cluster health and utilization monitoring. Kubernetes clusters are typically shared across teams. Cluster owners are responsible for providing enough resources and capacity to properly host and run workloads and support the teams who rely on them. Dynatrace provides the needed insights:
- Cluster health and utilization of nodes
- Health status of individual Kubernetes nodes
- Requested usage of resources compared to actual usage
- How much additional workload can be deployed per node
Distributed tracing:
Distributed tracing is about seeing how requests flow through thousands of different services. It is key to finding the cause-and-effect relationship of breakdowns or performance issues. While other solutions require manual instrumentation and have limited visibility into containers, Dynatrace provides:
- Real time discovery of all containers and microservices
- Automated instrumentation of services running inside of containers with zero changes of the code, container images or deployments
- Code level visibility for fast problem resolution

Logs:
A log file tells you about an event that has already happened; it is a record of events from software and operating systems. As they are automatically generated by the system, Log files can contain mountains of info, but are only as informative or valuable as the ability to process and understand the data they contain. One of the primary responsibilities of a log file is to keep track of any “issues” or anomalies. Contrary to what we see in movies, computers and devices don’t simply catch fire and explode when something goes wrong; there are in fact many examples or “mini-failures” which occur which are in fact captured in the log files; the more a system begins to fail, the higher the likelihood that there will be a larger issue down the line.
The Dynatrace OneAgent automatically detects log files and puts them in context with the corresponding host or process with no manual configuration. All detected log files are listed on the corresponding process group/process or host overview pages.
Our AI engine, Davis®, is built from the ground up to automatically pinpoint anomalies and provide precise root-cause analysis for highly distributed containerized environments. Real-time visibility into containers combined with semantically enriched log, tracing and real user data are the foundation for Davis to precisely determine the:
- Functional root-cause of a performance or availability problem
- Foundational root-cause that is the deployment or configuration change responsible
- Impact to real users and business KPIs
3. Don’t forget automation
Wait…isn’t Kubernetes specifically designed to automate tasks associated with deploying clustered services? Well, yes…to a degree. We can summarize a list of automation capabilities provided as:
- Automatic deployment of application services
- Automatic rollout/rollback of containers
- Automatic configuration of application network
- Automatic service distribution
- Automatic resource allocation for application services
- Automatic Bin Packing
- Automatic load balancing
- Automatic failover/replication of application components
That’s quite a list…but there are still some aspects missing which can drastically reduce development and deployment cycles.
As mentioned above, there are many blind-spots within an out-of-the-box Kubernetes environment, such as the container runtimes and layers running atop of K8s, like Istio and Linkerd service mesh – which like the containers themselves, were simply not designed to be observable. And if they actually are discovered, would most likely require some manual “fine-tuning” or instrumentation given the diversity of any given Microservices environment. Dynatrace continuously auto-discovers them all in real-time and gives you full visibility without changing a single line of code. The OneAgent architecture of Dynatrace continuously deploys to all clusters and nodes; in effect, to every layer running in your environment, such as:
- Applications
- Services
- Processes
- Hosts
- Datacenters
This same approach to automation is also applied to distributed tracing, giving you the ability to see how requests flow through thousands of different services. This accelerates mean time to resolve (MTTR) by finding the cause-and-effect relationship of breakdowns or performance issues. While other solutions require manual instrumentation and have limited visibility into containers Dynatrace auto-instruments services running inside of containers- once again, with zero changes to the code, container images or deployments.

Dynatrace is the only full-stack monitoring platform that provides fully automated, zero-config, distributed tracing, metrics, and code-level visibility into distributed applications without changing code, Docker images, or deployments. In summary, whether you are a seasoned veteran of Kubernetes or just getting started, we hope that by first doing a complexity assessment, taking full advantage of automation and remembering the importance of an AI-powered monitoring solution upfront that you will eliminate many of the “Pit Falls” when deploying your containerized environment or building your applications within it.
Click here to sign up for a Free 15-day trial, or contact us directly for a demo.


Looking for answers?
Start a new discussion or ask for help in our Q&A forum.
Go to forum