You might already use Dynatrace Log Monitoring to gain direct access to the log content of your system’s mission-critical processes. Log Monitoring is a great way to search for text patterns like log files with errors or exceptions. But sometimes you might have a scenario where simple access to log file content is not enough—you need to create a metric for log entries that contain “Error,” for instance, or something more complex like “Error and not Warning.” In such cases, you need the ability to turn log data into custom metrics.
Improved monitoring insights with AI-powered custom log metrics
We now allow all our customers to create custom metrics by turning log data into metrics and analyze them over time. Moreover, you also have the ability to chart these log metrics and pin them to your favorite dashboards. This enriches your monitoring insights and empowers your teams to troubleshoot quickly and efficiently.
With this update, we also took the next step towards utilizing more Davis® intelligence for Log Monitoring, as the observations are automatically made by the Davis AI causation engine.
How to create custom metrics based on logs
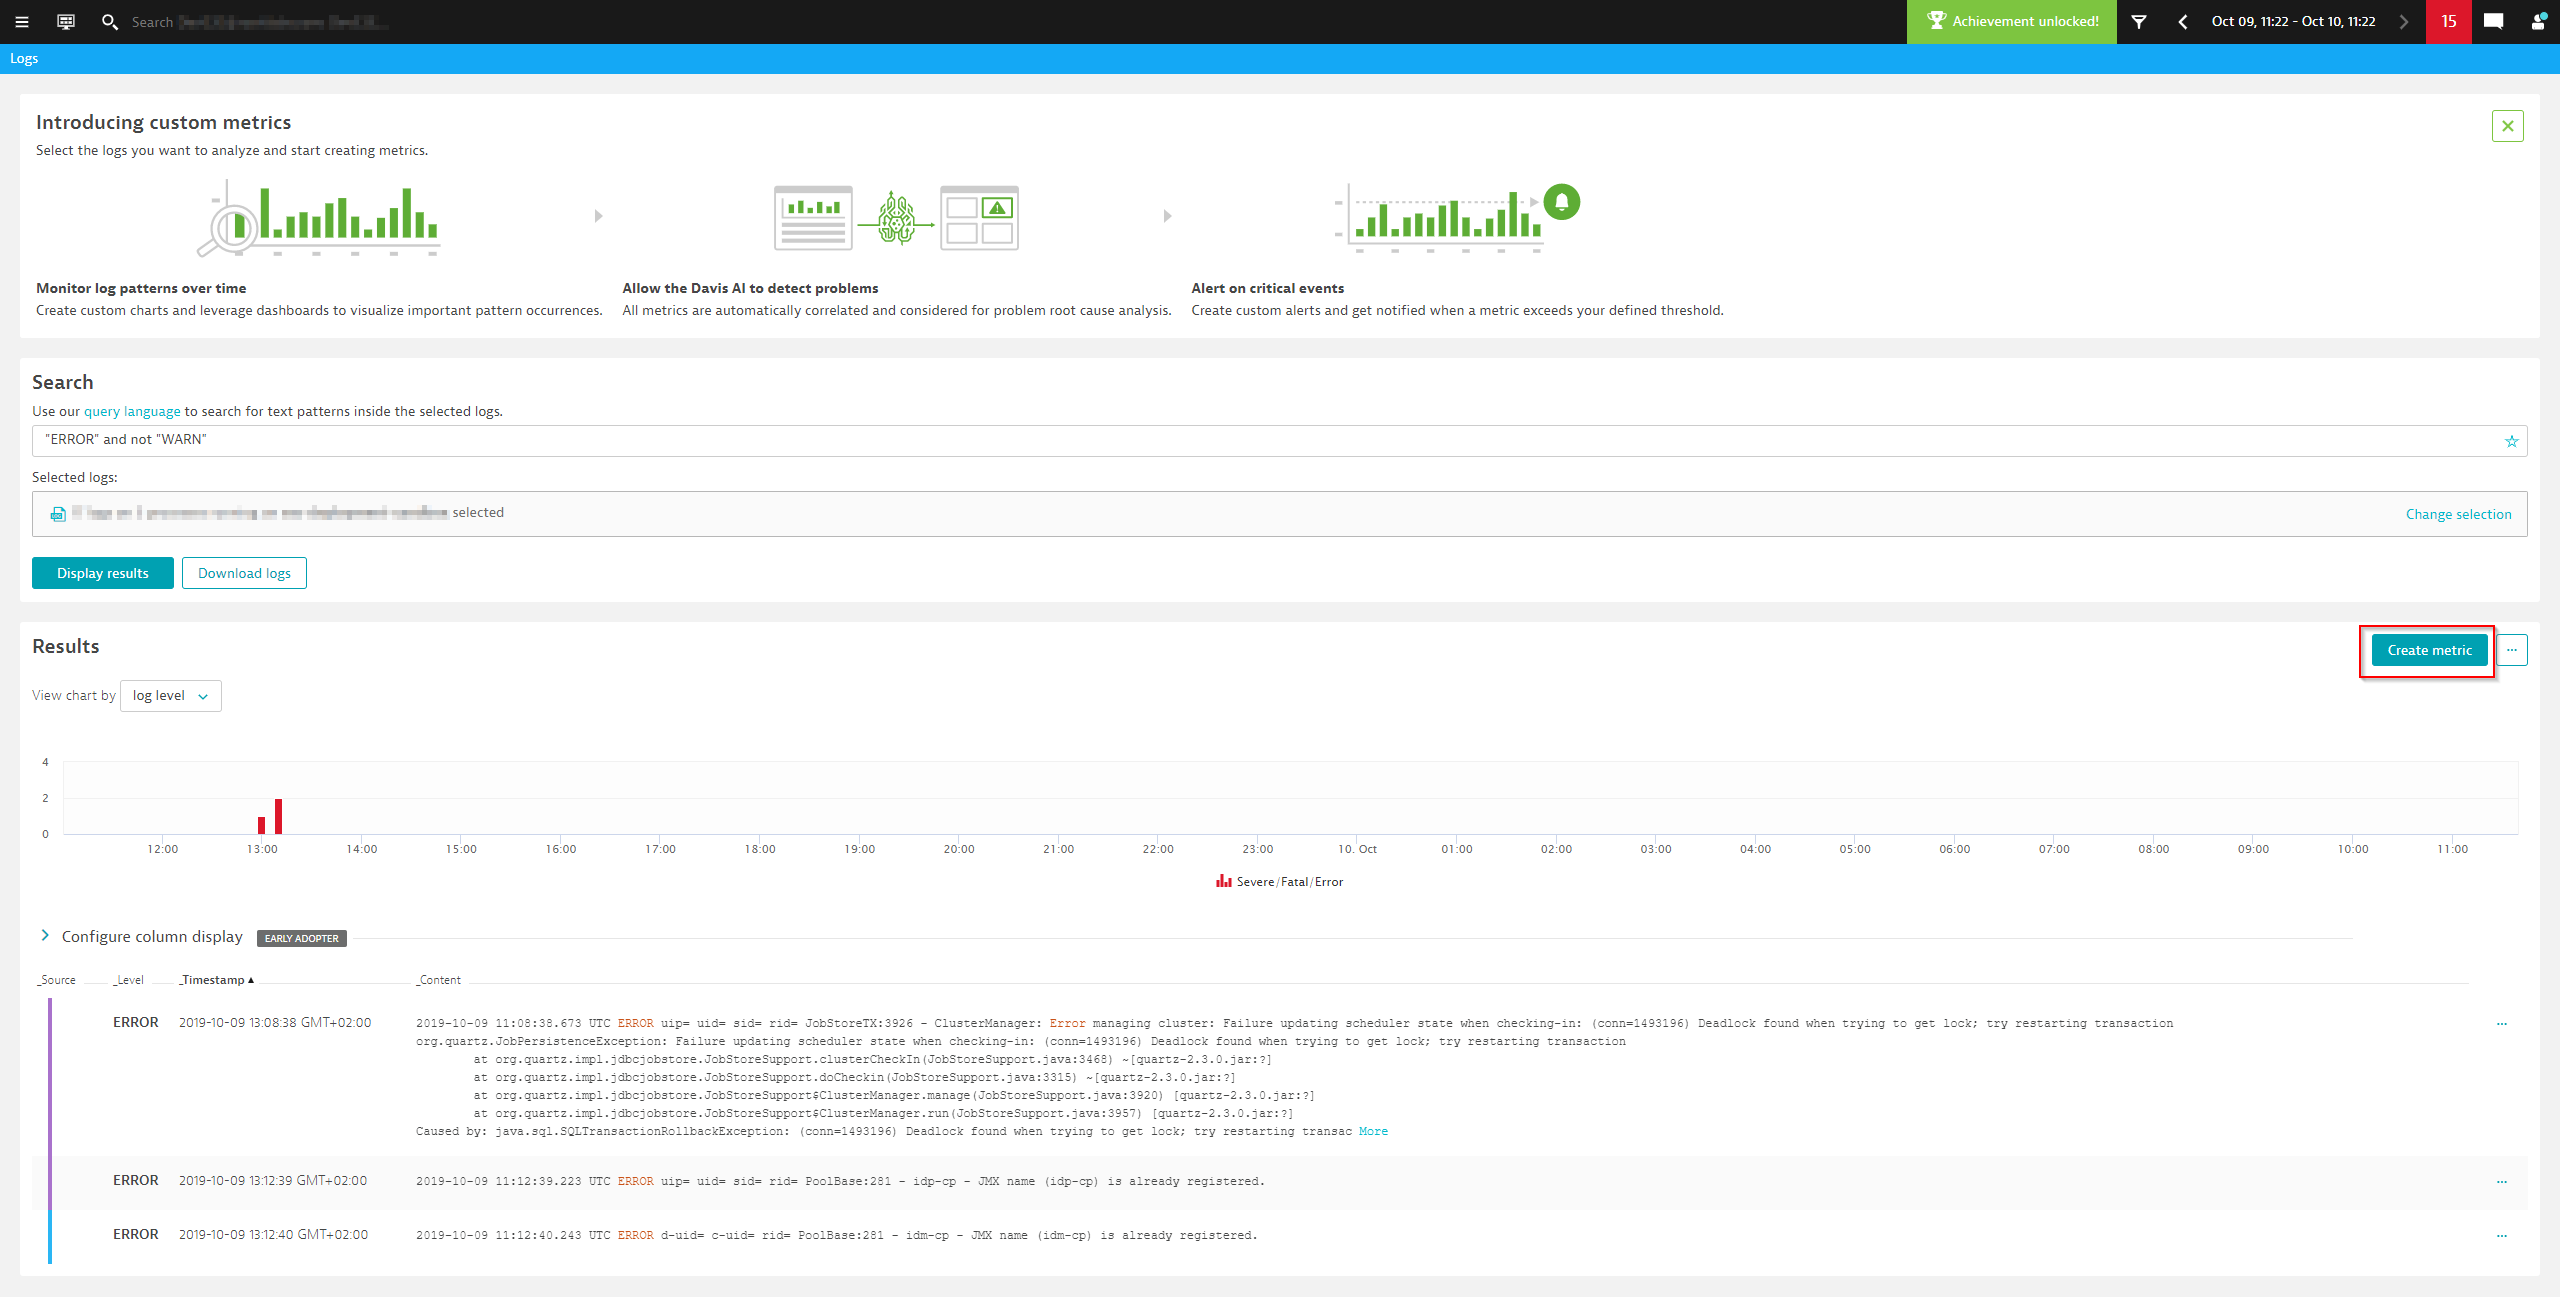
Please note that custom metrics are only available for monitored log files (centrally stored). If this is the case, then you can access the log file in multiple ways—via problem details, a host or process page, or the Log viewer. Once you select Display results, you see the Create metric button.
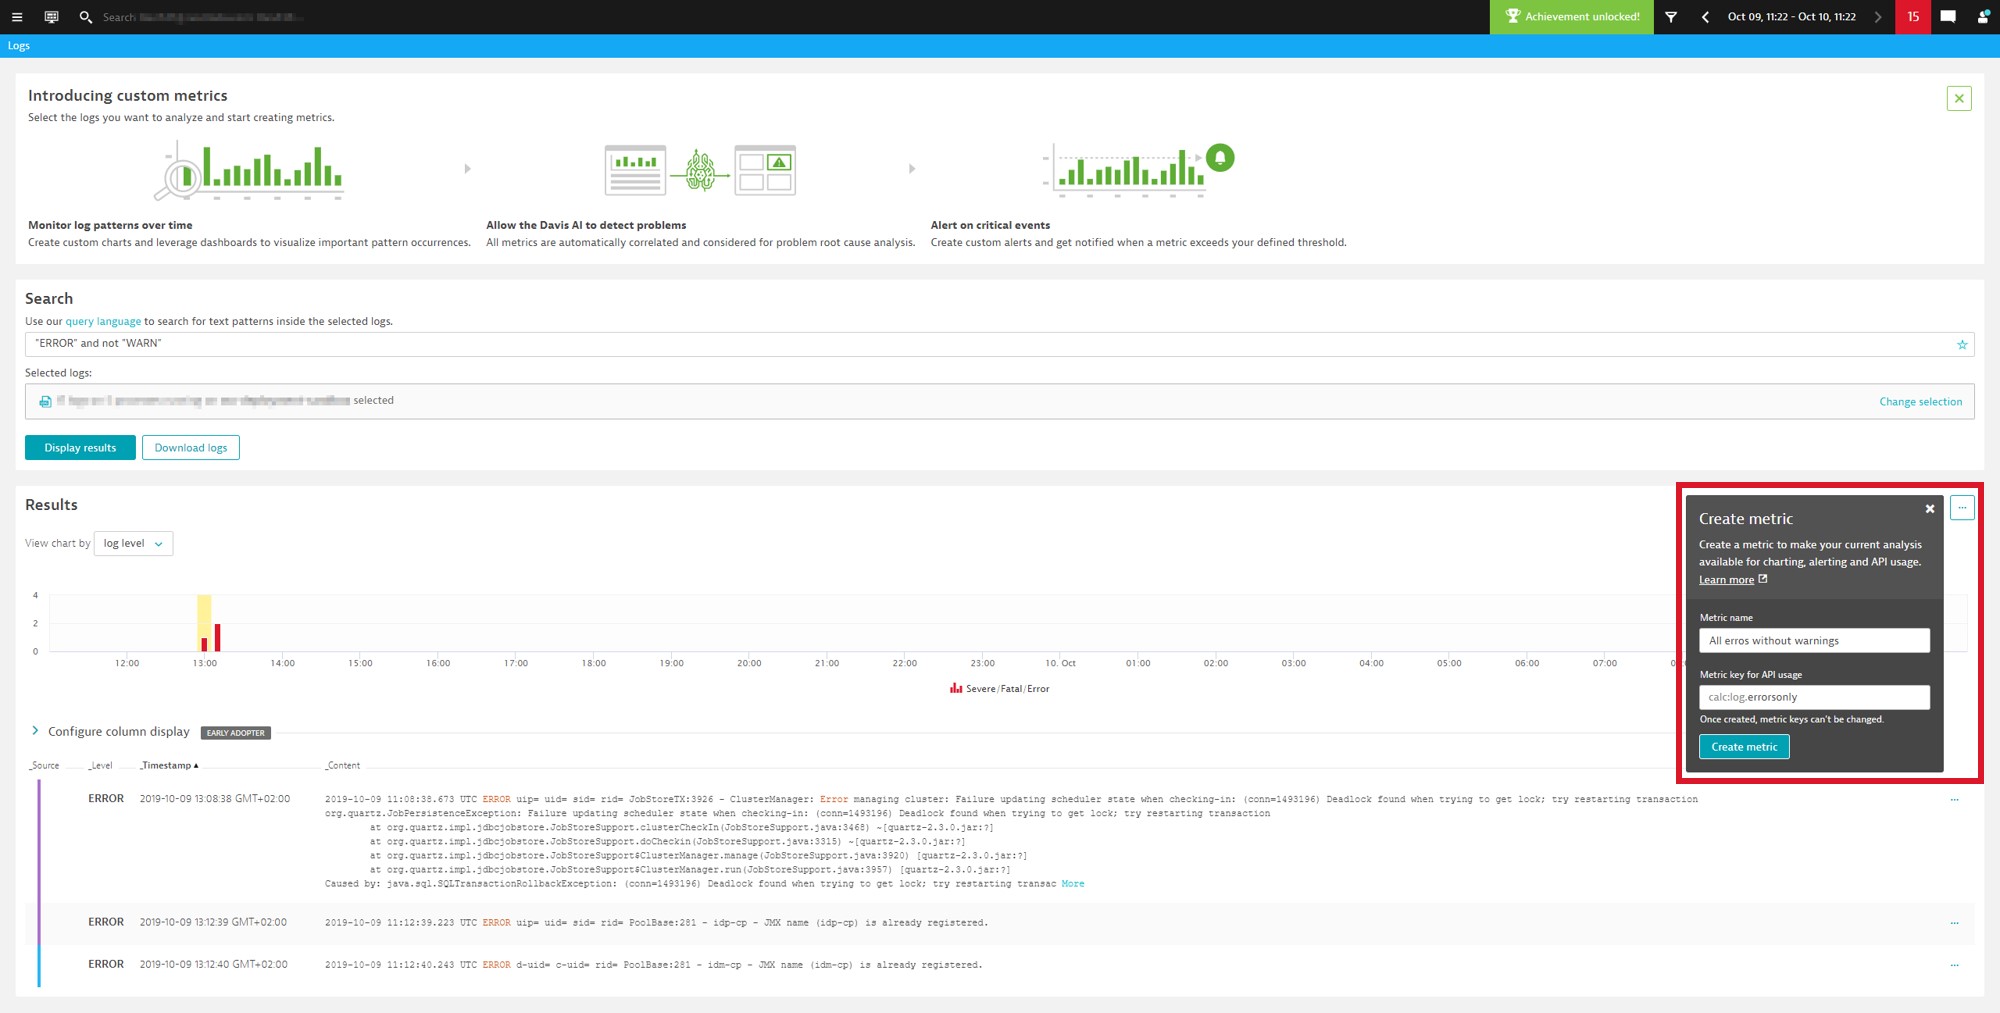
Make sure you’ve modified your query to get the correct results before generating a new metric. When you’re satisfied with your log query, select Create metric to subscribe to a new metric based on your query. You can specify a metric name and an API key for further API usage. Be aware that the API key is immutable and cannot be changed after creation.
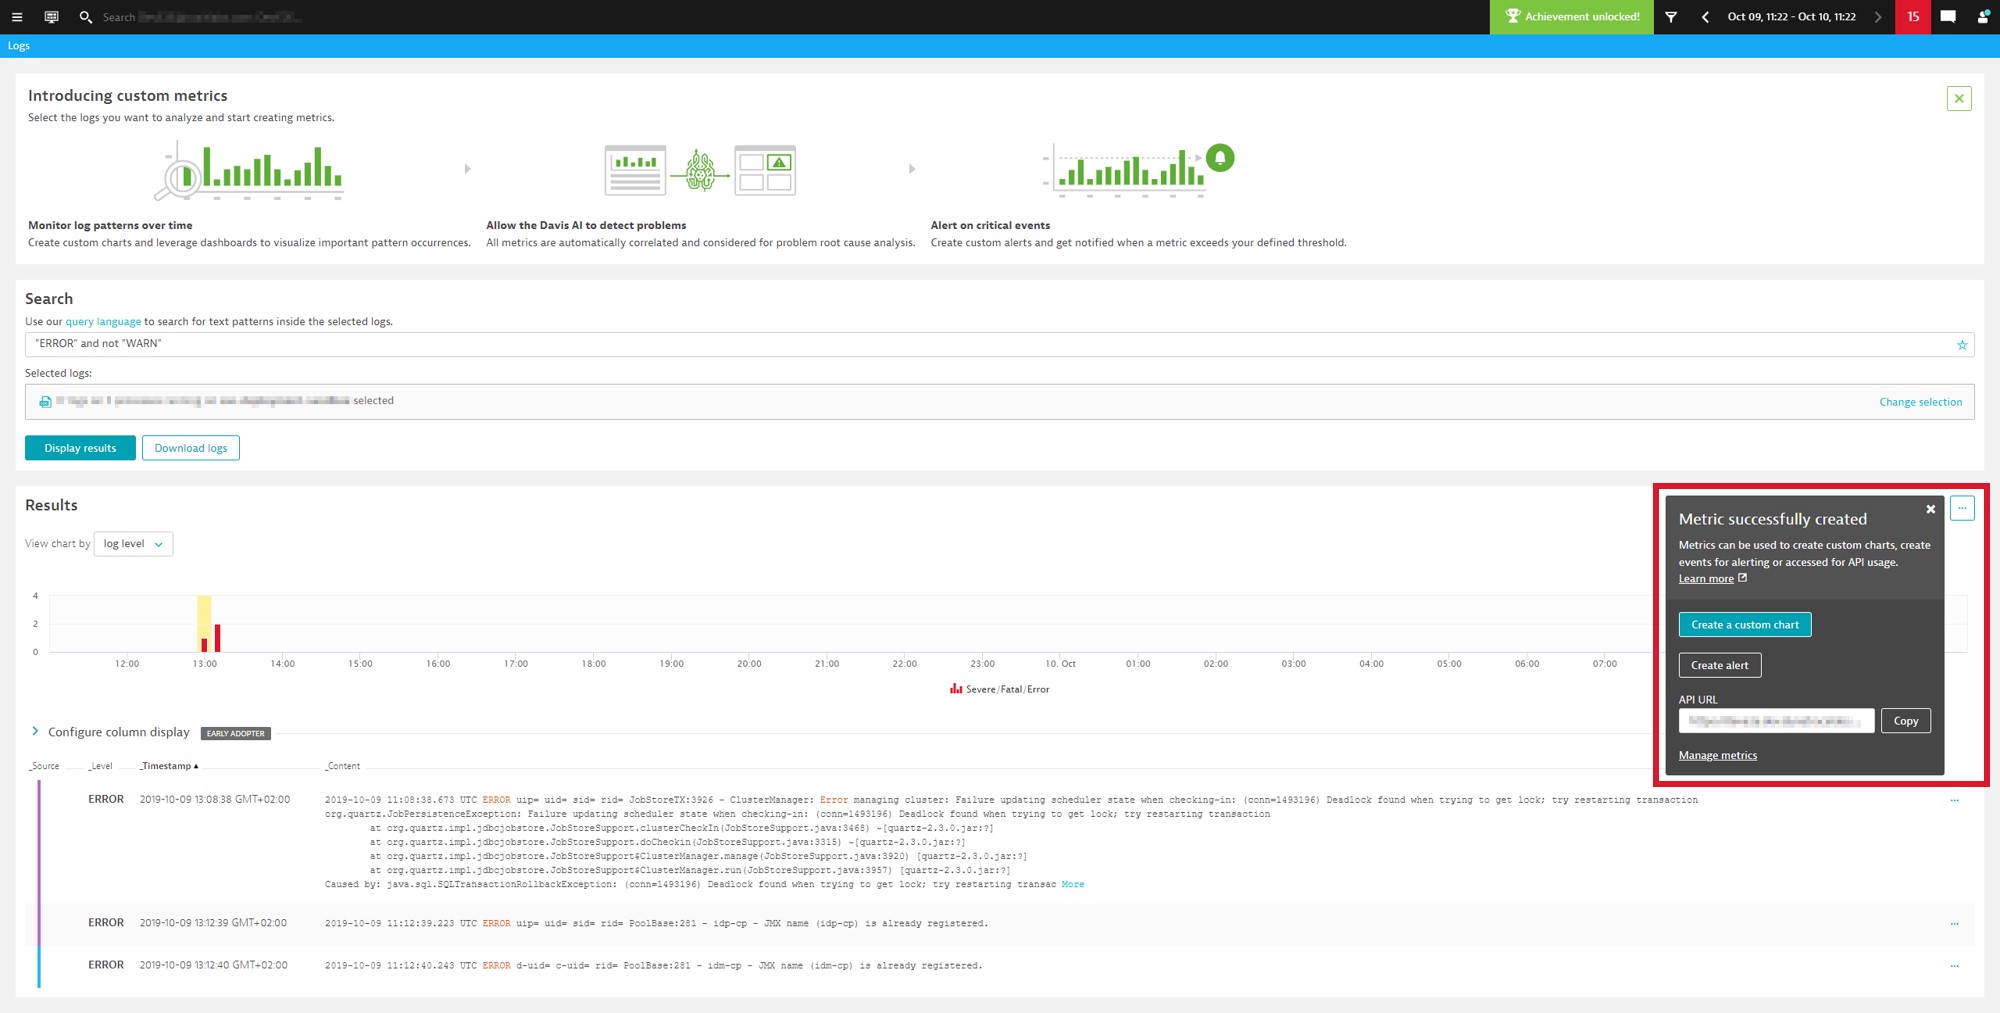
That’s it, you’re done! Now you can create a custom chart based on the new metric for your favorite dashboard. You can also access the metric via API using the specified API key.
Check out our help page for custom log metrics for details on metric creation.
Events based on custom log metrics (coming soon)
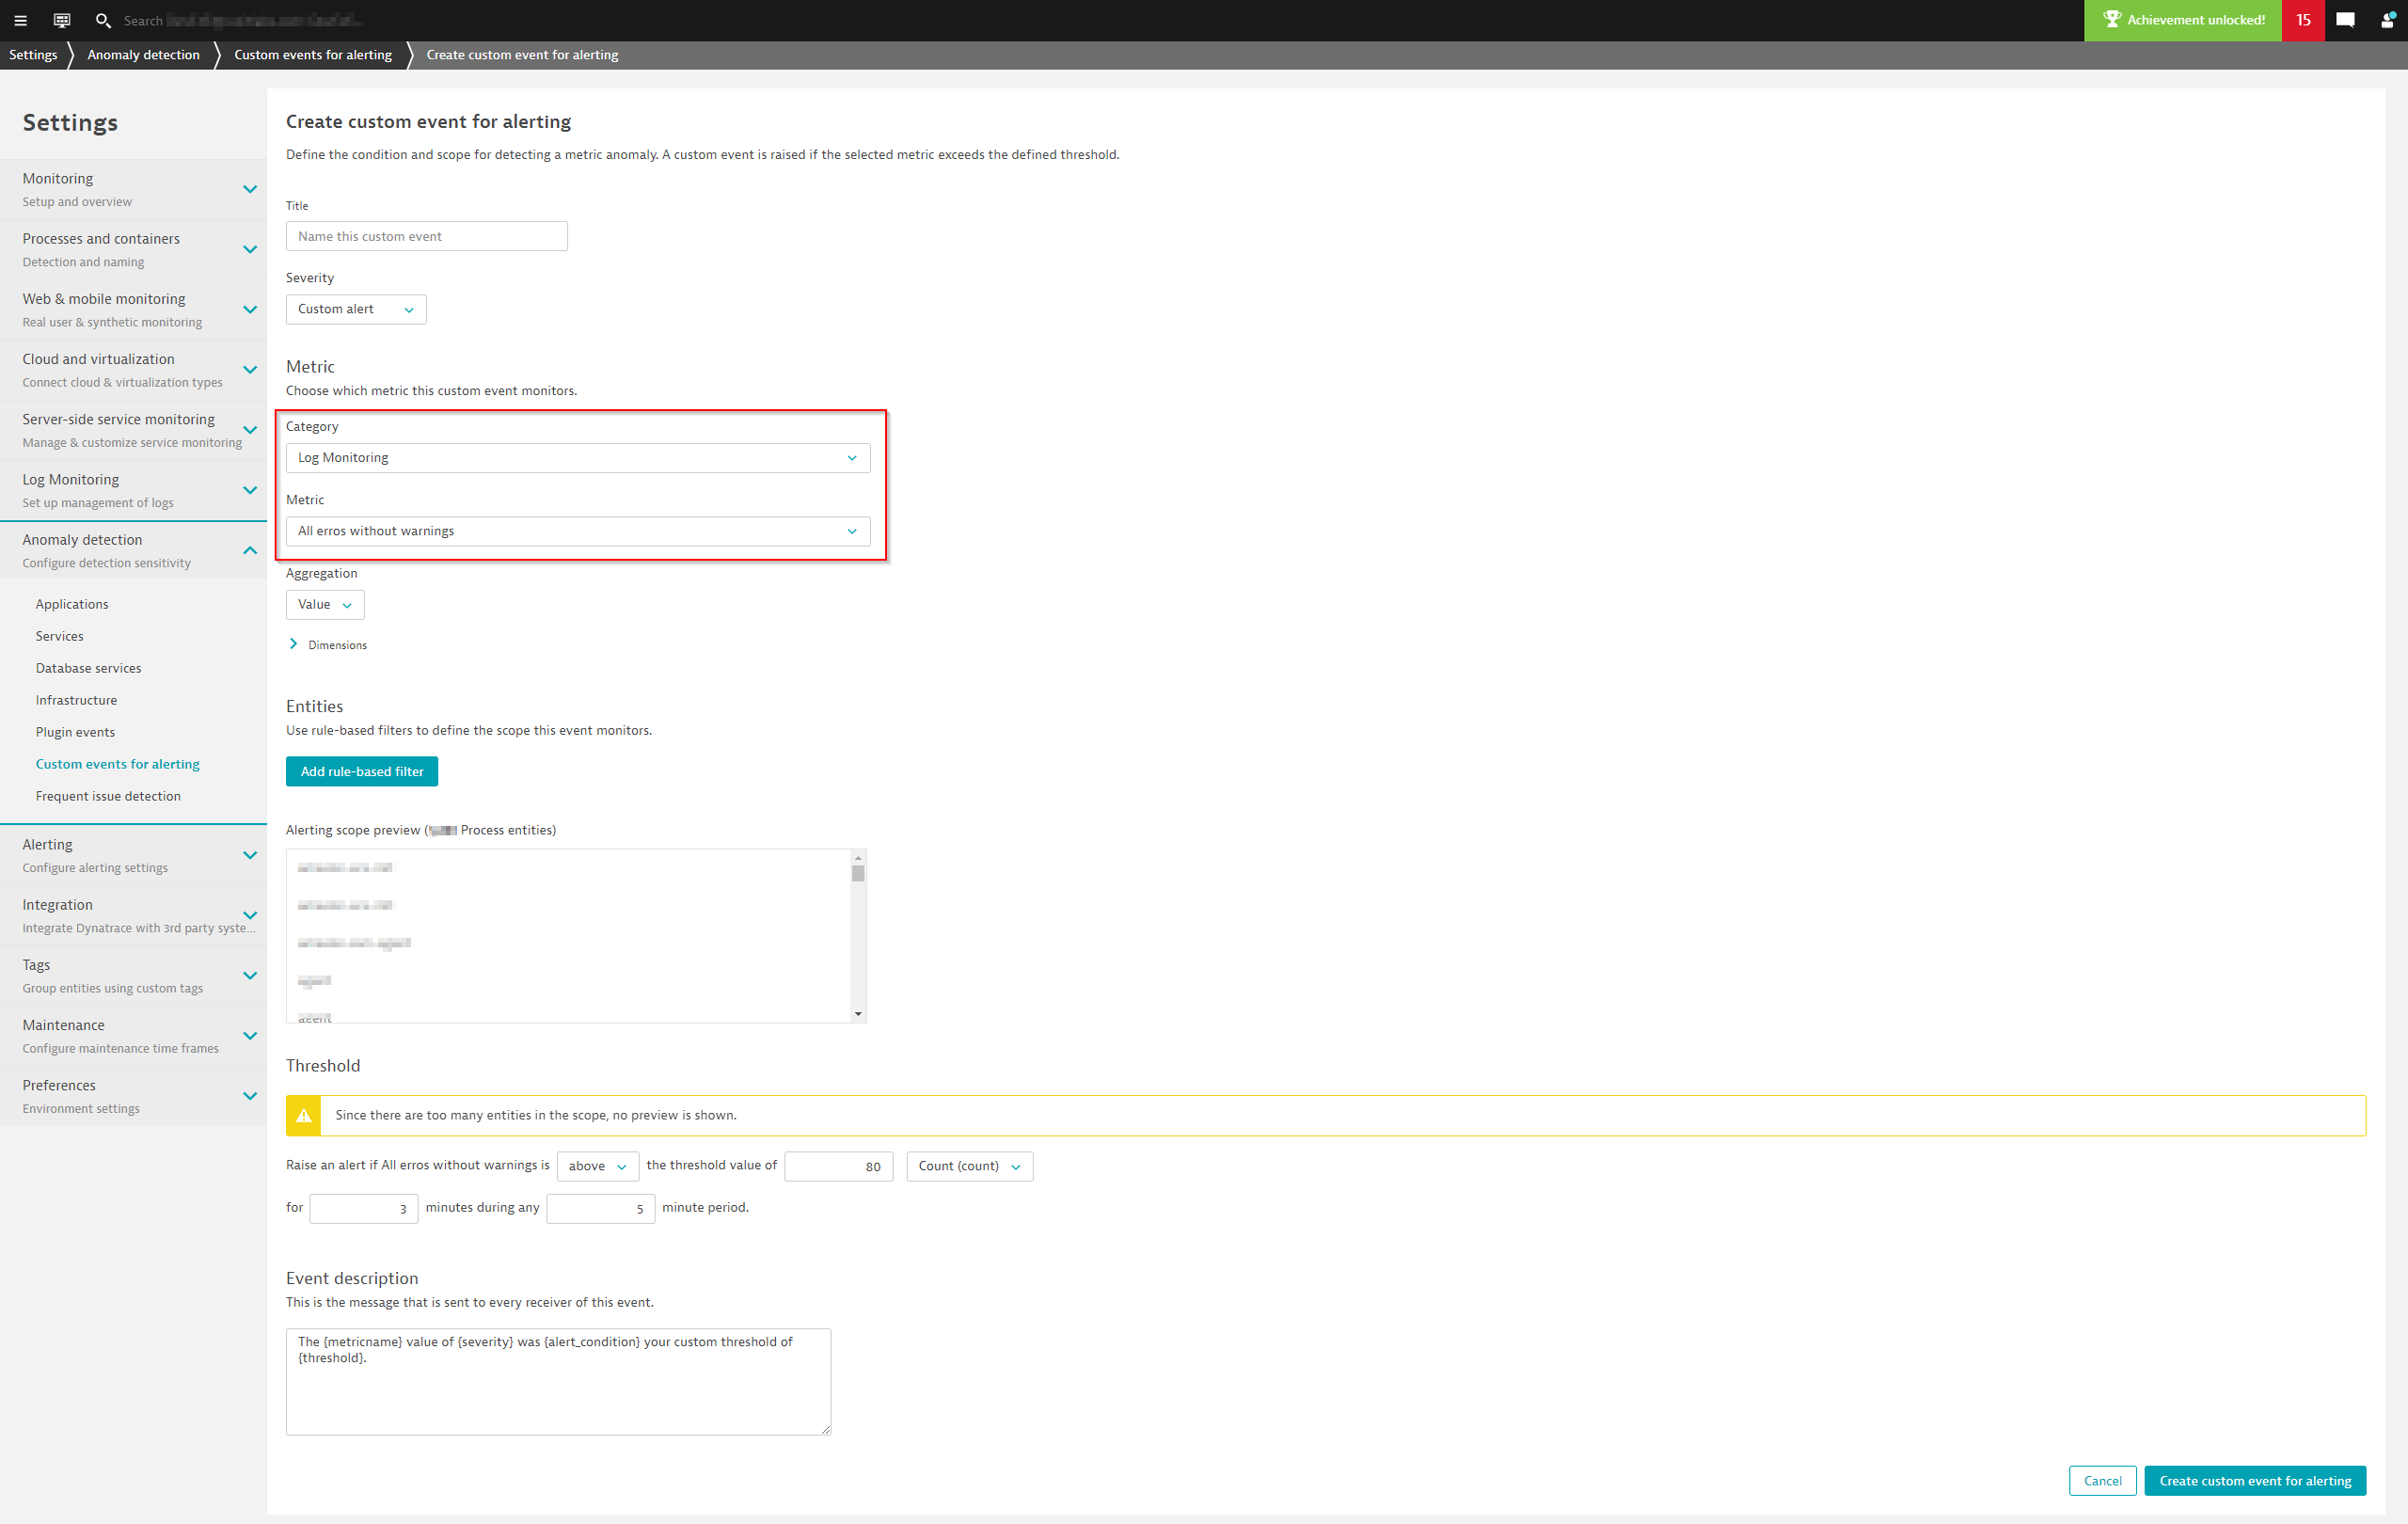
With Dynatrace version 1.179, you’ll also have the ability to generate custom events based on custom log metrics. Navigate to Settings > Anomaly detection > Custom events for alerting and configure a custom event to meet your needs.
A shortcut is also available to create a custom event when you create a custom log metric. The Create event button takes you directly to the custom event settings page with the metric you just defined. All you need to do is specify the desired rules and thresholds.
Prerequisites
- Dynatrace version 1.178
- Free available metrics, as we charge for consumed metrics (100 metrics are free per environment; you can buy more if needed)
- Log files must be monitored (centrally stored)
- Only for pattern occurrences (parsed log messages are not covered in this release and will come later)
Important: Old log events are deprecated and will be removed
With the introduction of custom metrics, old log events are deprecated (announced in this blog post).
Existing log events will remain unchanged and continue to work. Currently it is planned with Dynatrace version 1.190, to remove old log events completely. In other words, old events will no longer work. There’s also no migration path for existing events. Please make sure you’ve configured new custom metrics before we delete old log events.
What’s next
We’re constantly improving the quality of our Log Monitoring offering and have many new enhancements in the pipeline:
- A new custom event screen (see our blog post)
- UI to modify created metrics
- Improved query performance
- Custom metrics based on parsed log messages
- Integrations for different log sources (AWS, Syslog, etc.)
Your feedback matters
We’re ramping up, and as always, we’re listening closely to your feedback. Please share your feedback and use cases with us in our product ideas forum.



Looking for answers?
Start a new discussion or ask for help in our Q&A forum.
Go to forum