Dynatrace has become the de facto standard for monitoring web-scale software production environments, which also means having to present information on huge numbers of monitored services, processes, and hosts.
The release of Dynatrace version 1.170 dramatically improves the load speed for loading such large lists of services, processes, and hosts.
As an additional benefit, the overall design of lists and relevant filters has been improved, so you can expect the same consistent filtering behavior no matter whether you load a list of services or a list of hosts.
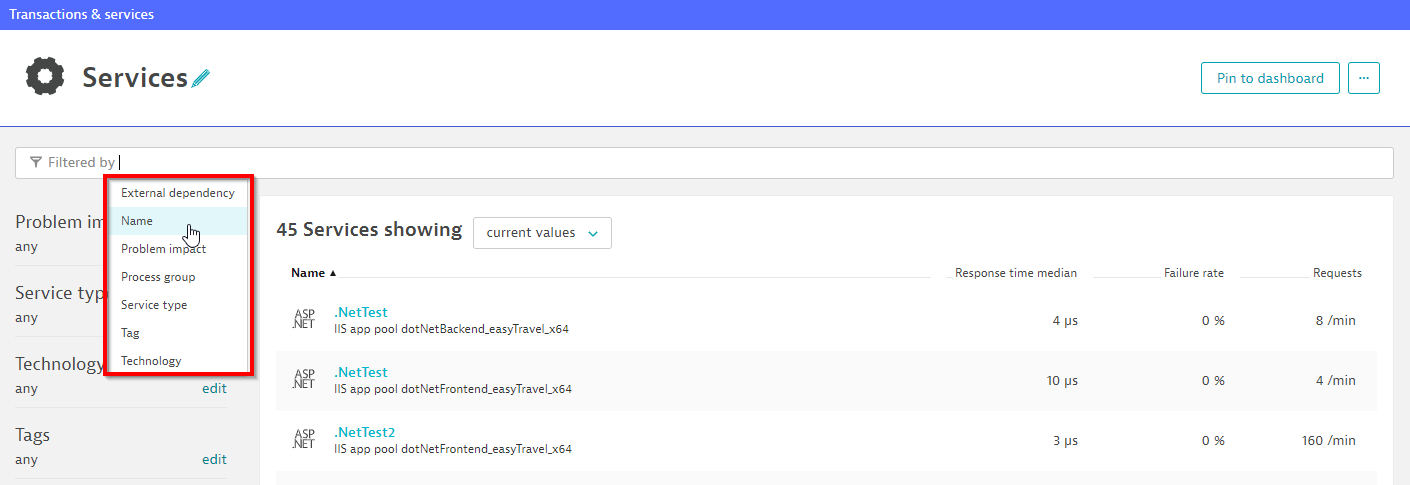
The screenshot below shows our improved design for the service list. The following examples will guide you through the most important features and filtering possibilities of the new lists.
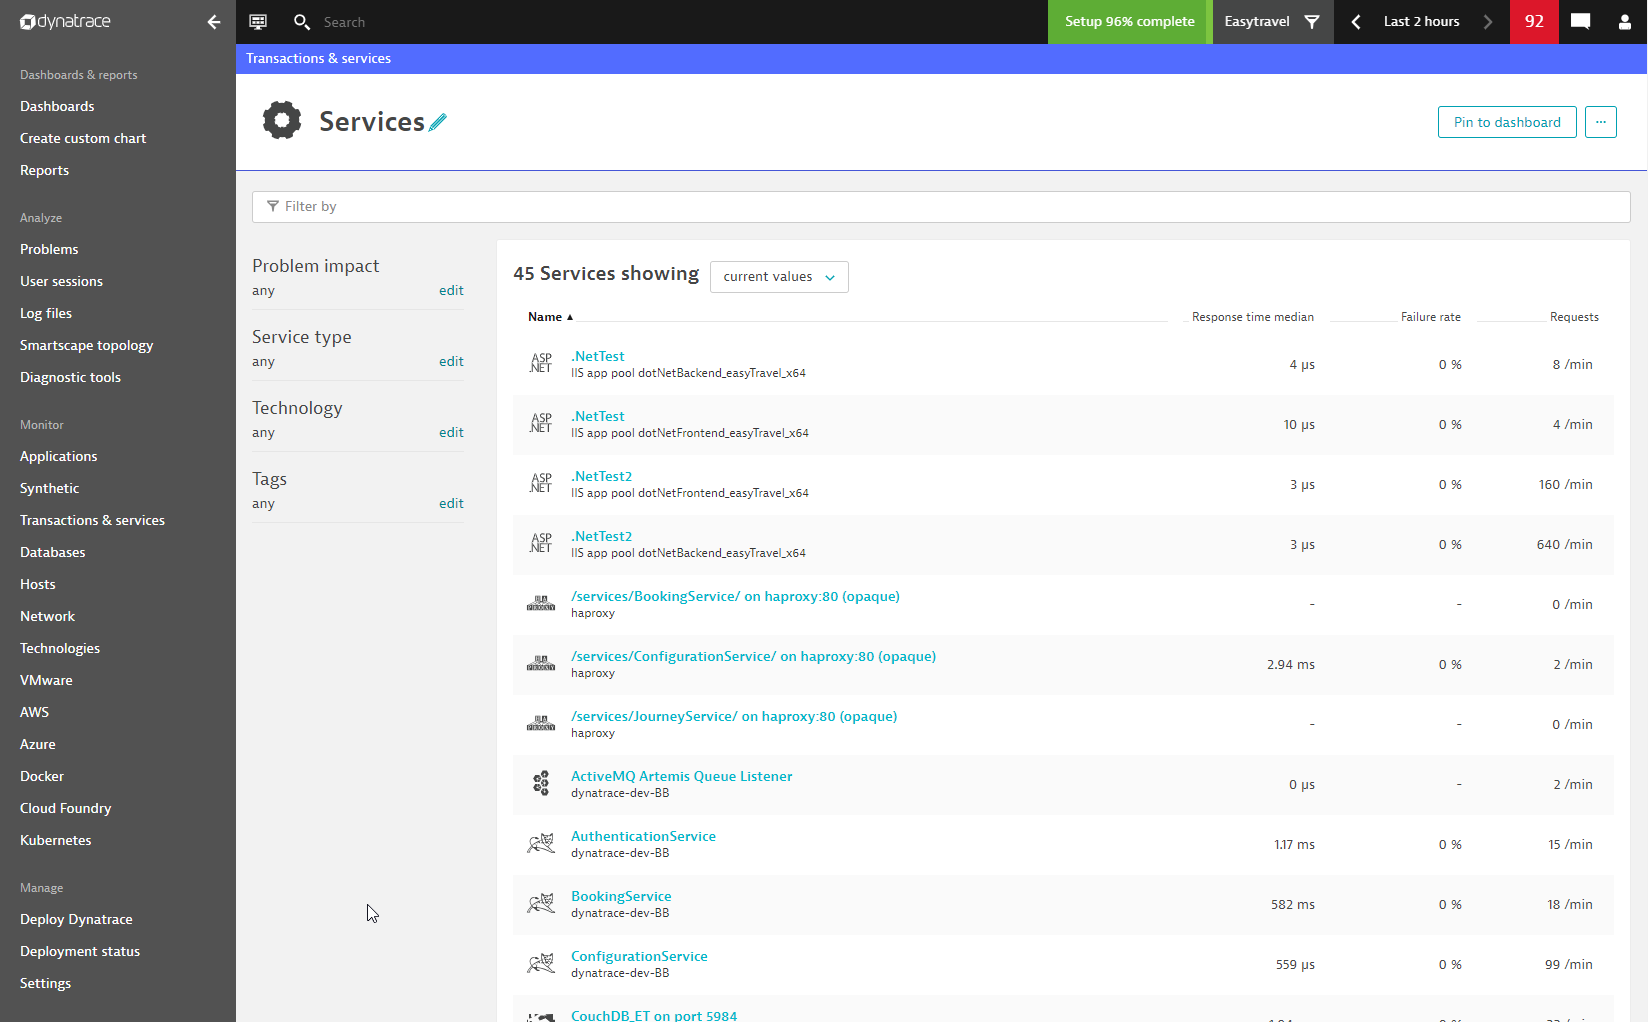
Each list has a convenient filter bar on top that offers all available filters. Selected filters are also shown in the column left of the list. The filters are available regardless of the size of the list—notice that the list above contains just 45 services, which we would not consider a large list.
This is because the list has already been filtered using one our most important filters—management zones!
Management zone filter
The management zone filter is shown in the top bar of the Dynatrace portal. In our example above, the list of services is filtered for the “Easytravel” management zone and shows only the 45 services belonging to it.
In general, management zones are the most important filter available in Dynatrace and offer a lot of flexibility in grouping your entire environment according to various dimensions such as team ownership or assignment group.
The screenshot below shows how to change the management zone filter for the service list:
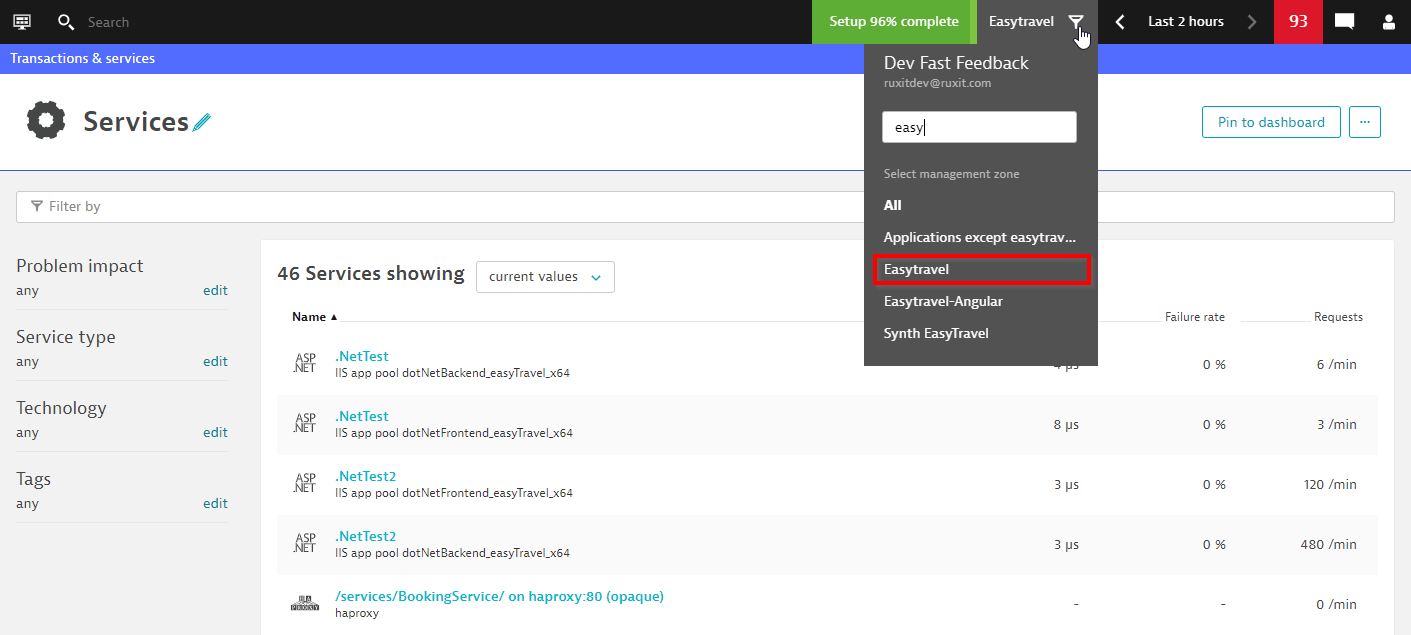
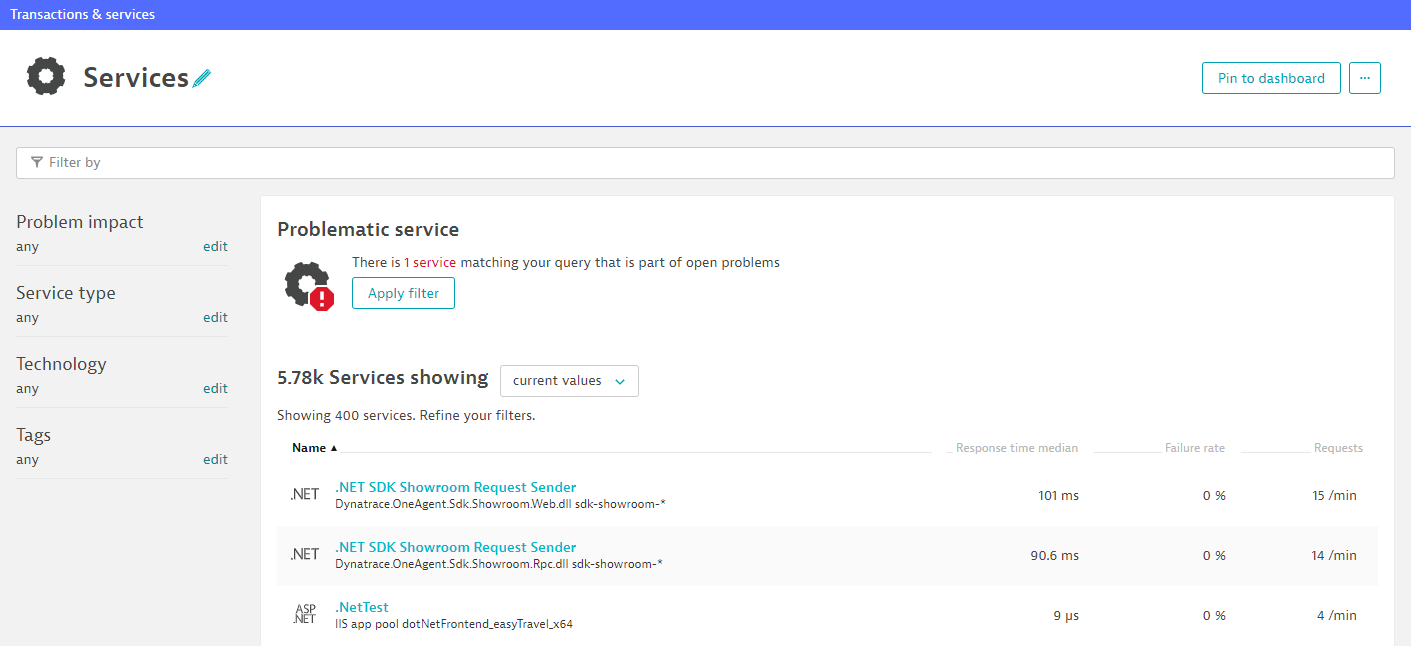
Removing the management zone filter reveals the total number of services in the monitoring environment, which is a whopping 5,780!
Even with such a large number of services, the list loads within seconds to show the overall number of services and, as shown below, how many of those services are in an unhealthy state:
Problem impact filter
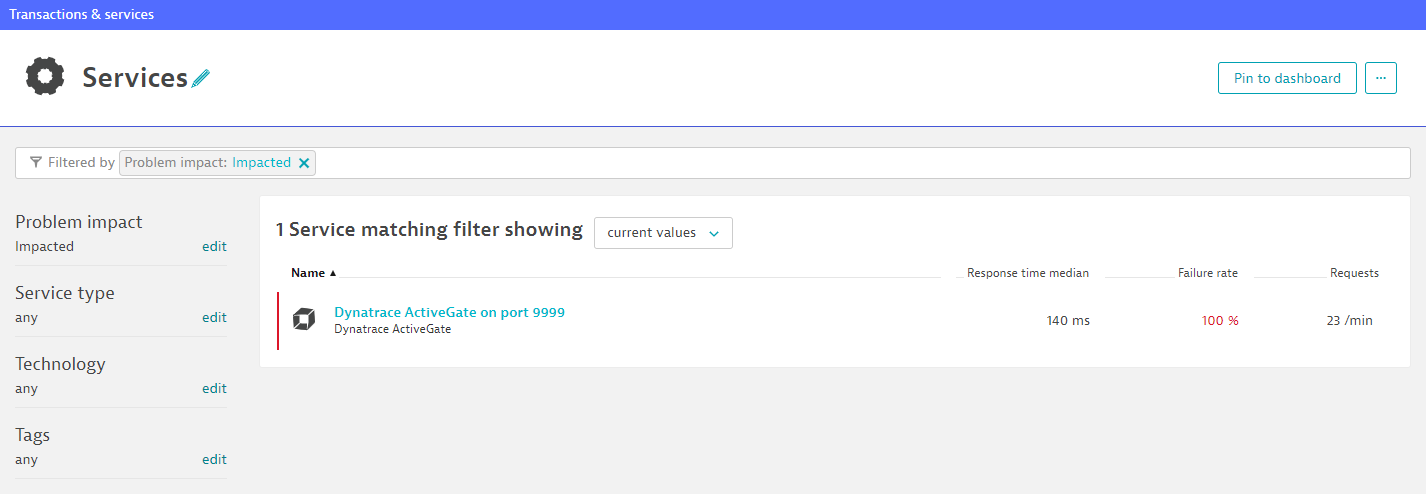
One of the new filters that was introduced with the latest Dynatrace release is the filter for problem-impacted services. Applying the filter shows only those services that are in an unhealthy state, meaning those that currently have an open problem.
The screenshot below shows the service list filtered to show services with problems:
Flexible name filter
Another extremely flexible new filter is based on the name of your services. Say you don’t want to always create a tag or management zone to filter a group of services that have some logical relationship. In such a case, the Name filter offers high flexibility by allowing you to enter any string from the name of your services.
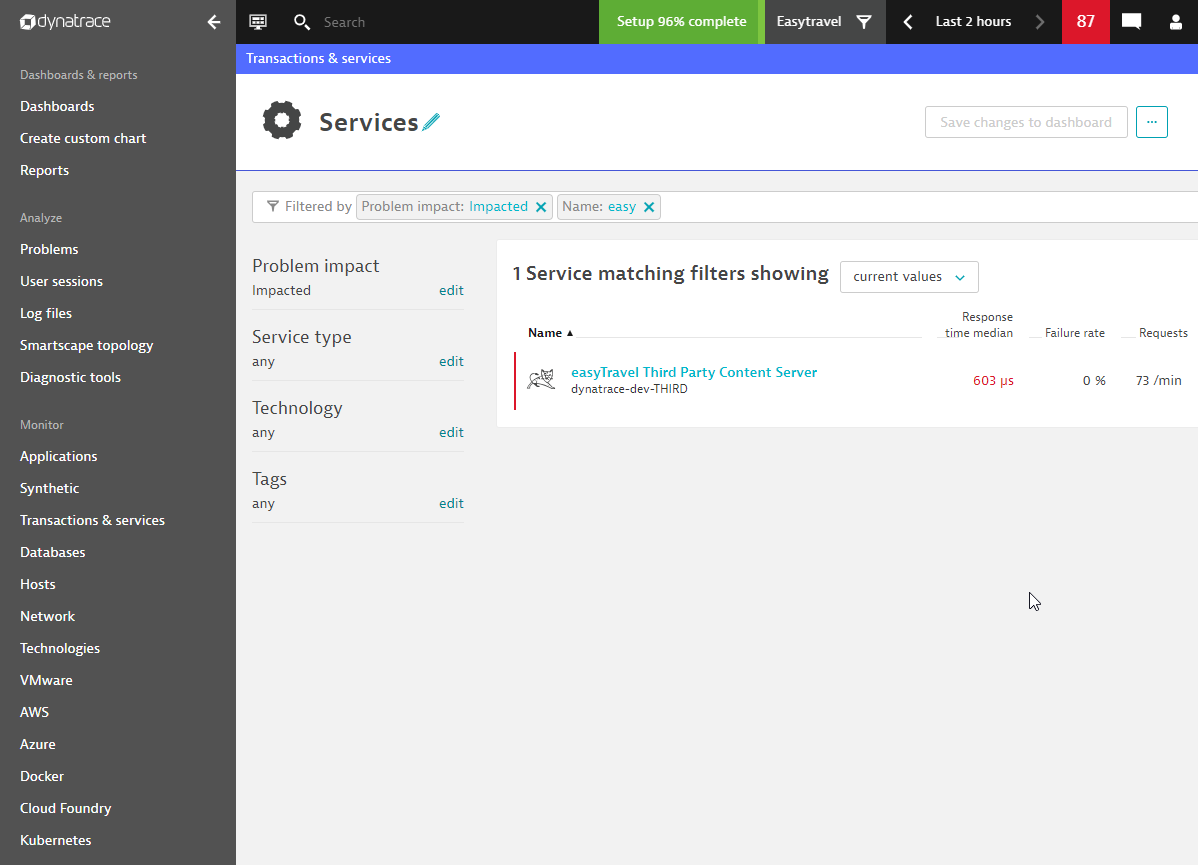
The images below show a Name filter that queries for all services with the string “easy” contained somewhere within the name:
Combine multiple filters to create an AIOps dashboard
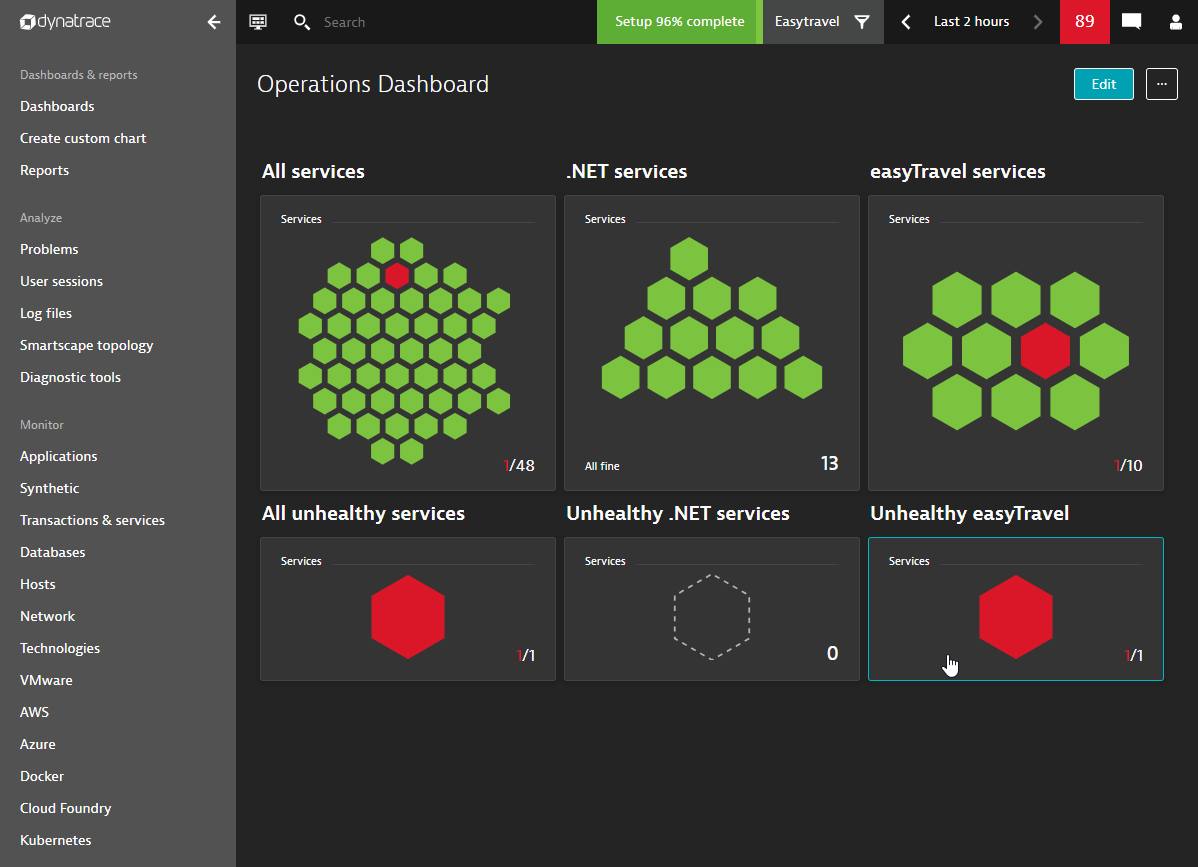
In the example below, I’ill show you how to use a combination of our new filters to create a convenient AIOps dashboard that helps minimize the number of clicks to find unhealthy services.
First, you decide which cohorts of services belong to your most critical group and what kind of filters you would need to focus on those cohorts.
An example would be to filter for all your .NET technology services as shown below:
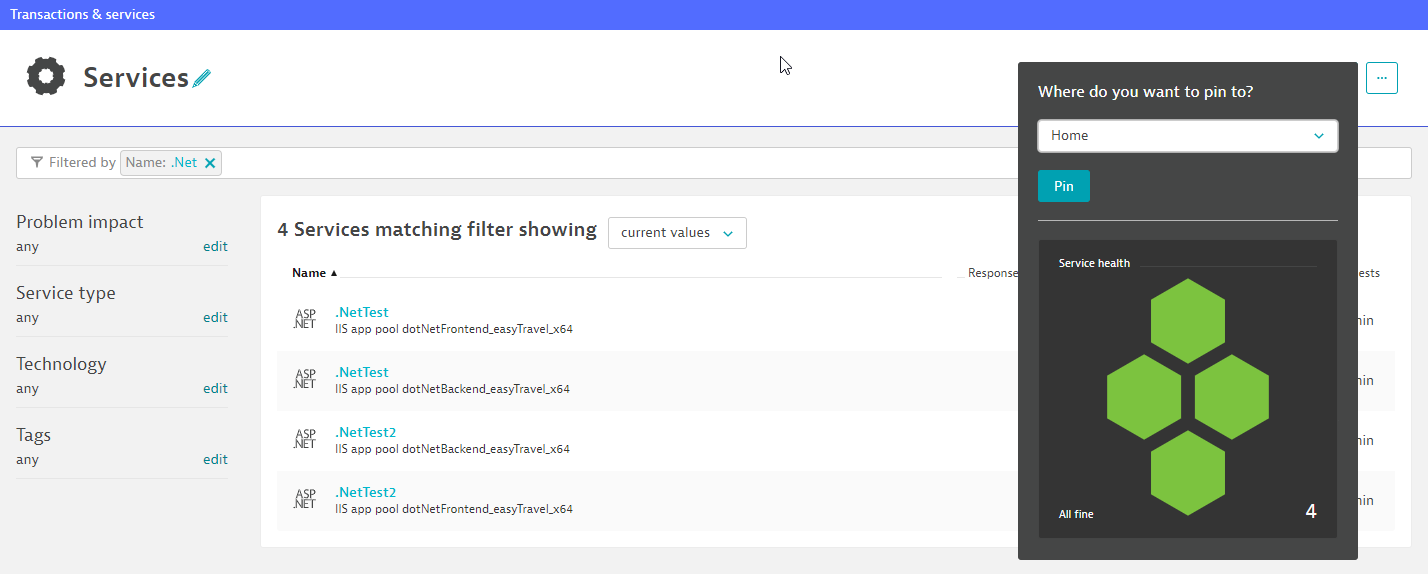
Clicking Pin to dashboard puts that cohort of services into your selected dashboard. The Services tile visualizes the health state of all your .NET services.
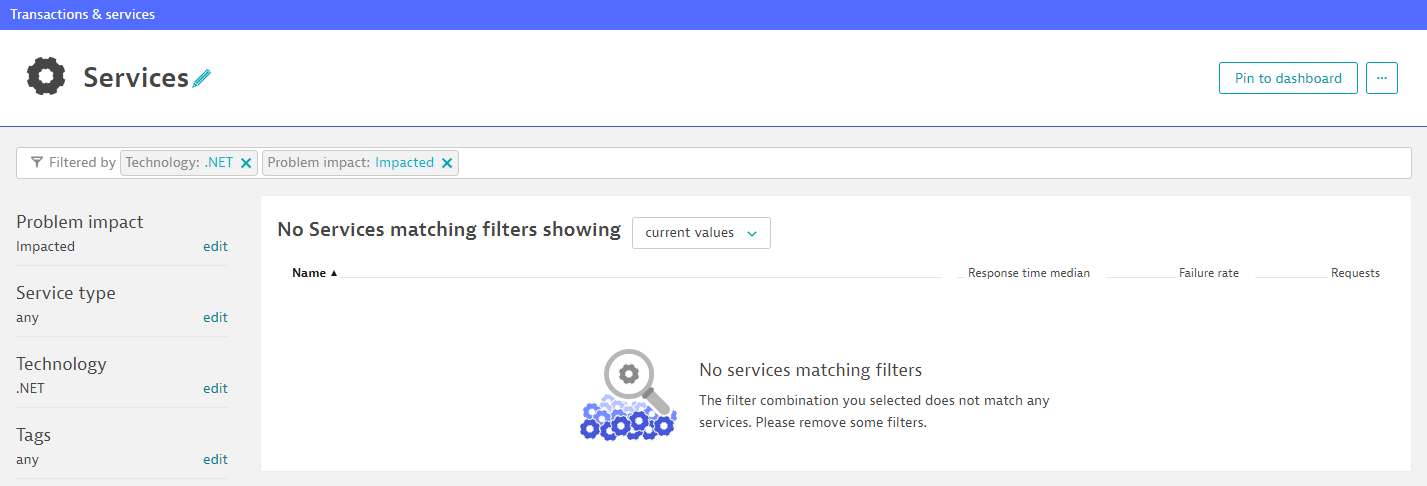
To reduce the number of clicks required to focus on your unhealthy services, you should also pin the same cohort but with the problem impact filter applied, as shown in the screenshot below. Even if the filter currently results in an empty list, pinning this Ops tile will allow you to quickly navigate to affected .NET services in case of a problem:
If you need to narrow down your .NET technology services into a smaller group, just use the name filter.
Using our filters, you can set up a convenient AIOps dashboard visualizing the health state of all your .NET services (or a smaller subset). Further filtering allows you to set up a tile of problem-impacted .NET services.
What about the host list?
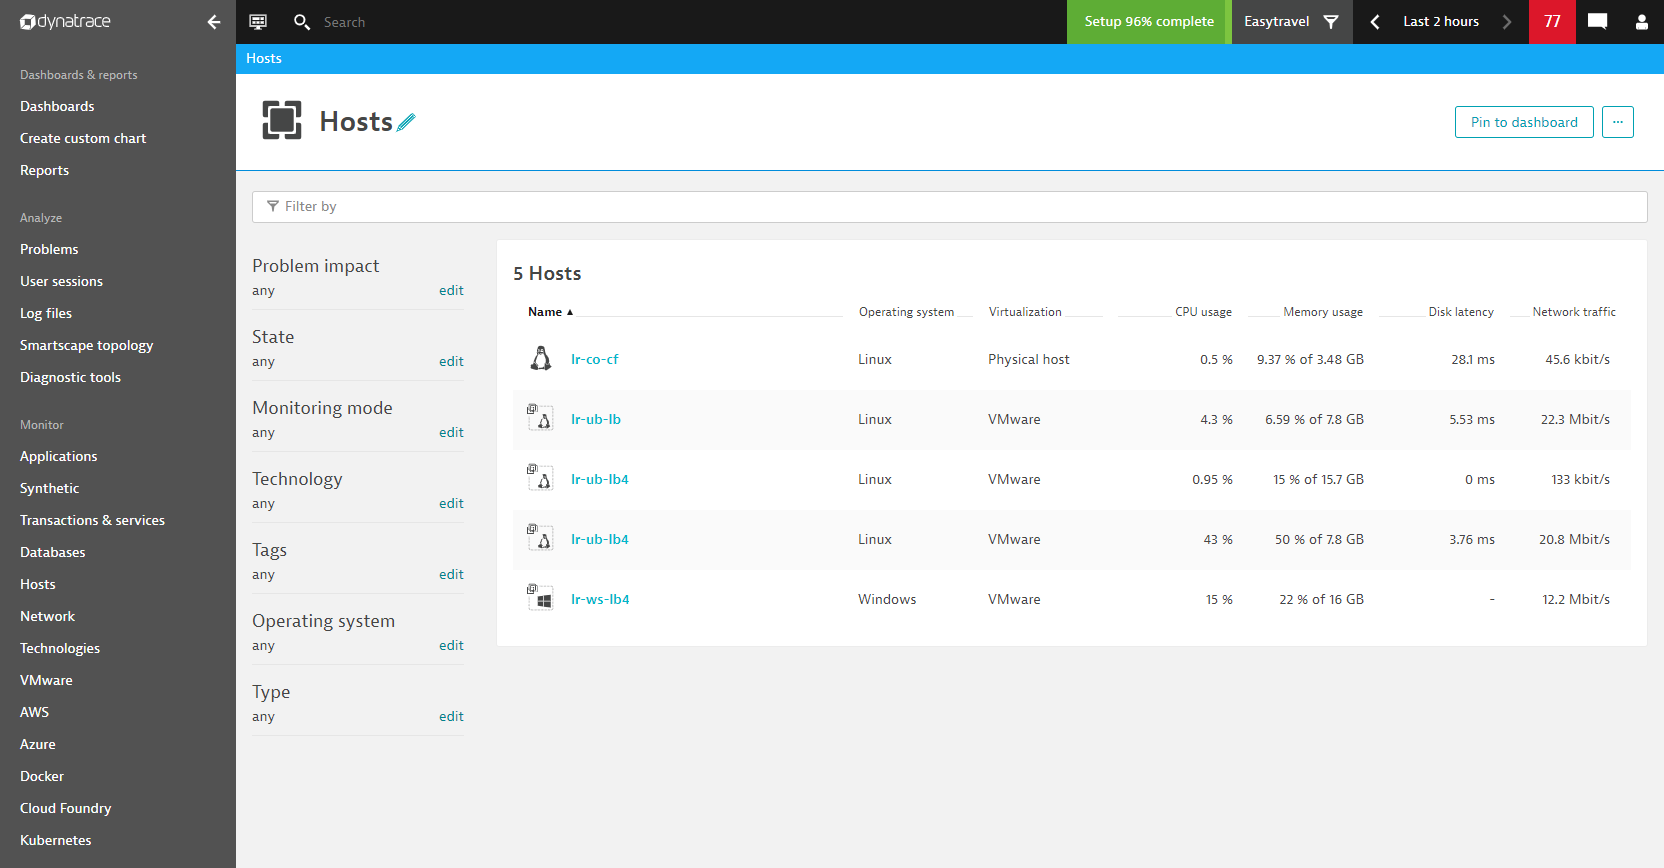
All the examples given above can also be applied to the host list. The goal of the redesigned list views and filters is to offer the same user experience and load speed in any Dynatrace list you’re interested in.
This also means that you can configure the same AIOps dashboard to show show services and hosts side by side, using the same methodology.
See the redesigned host list below:
What’s next?
Dynatrace delivers new features at a rapid rate and quickly adapts to the ever-increasing complexity and size of our customers’ environments. The completely redesigned, more scalable approach to presenting list views in your Dynatrace monitoring environments is just the first step.
Request attribute filter will be back soon – Service metrics are a flexible alternative
Due to changes that were made within the existing host and service lists, we’ve temporarily removed the request attribute filter, which didn’t perform well in larger environments. As request attributes are calculated dynamically upon each individual service request, this mechanism didn’t scale well enough within environments with more than ten thousand entities.
The planned next step is to reintroduce the requests attributes filter within the service list as well as within custom charts. The improved request attribute filtering will scale much better than the previous implementation and will be available with our September 2019 release.
A powerful alternative for charting business relevant service metrics was introduced recently. Service metrics offer a lot of flexibility for subscribing to specific business relevant request parameters. In many cases, a service metric can conveniently replace a service request filter within your custom charts.
The smart filter field is a better-performing replacement than one-click filters
Other feedback we’ve received relates to the importance of the one-click filter option, which is missing from the new list design.
The newly introduced smart filter field offers all the same filtering possibilities in a better performing approach, but users also want to set filters via single click or touch.
The planned next step here is to come up with design improvements that allow you to once again select filters within these lists with a single click.
Quickly review list charts with a new list action
Finally, we plan to offer a list action that allows you to quickly review a list chart again using our custom charting feature. This improvement is intended to replace the missing list chart and to help you quickly analyze metrics of cohorts of list items within a flexible chart.
Summary
The latest Dynatrace release focused on the redesign of the service, process, and host lists in order to offer higher load speed.
The problem impact filter, as well as name filters, were introduced to enable convenient filtering possibilities and to build AIOps health dashboards that reduce the number of clicks necessary to focus on unhealthy services or hosts.
Planned further service and host list improvements
Overall, the introduction of the new list styles for service and host lists was just a first step towards support improved support for web sized monitoring environments. In our ongoing efforts to improve the existing lists within Dynatrace, we also plan to:
- Reintroduce request attributes as a scalable filter for lists and charts
- Improve one-click filtering
- Offer a list chart replacement through a direct list action


Looking for answers?
Start a new discussion or ask for help in our Q&A forum.
Go to forum