Last year I announced my “Share Your AI-Detected Problem Pattern” initiative with the hope that Dynatrace users would share their real-life examples on how Dynatrace Davis®:
- Helps them detect problems.
- Delivers impact and root cause.
- Allows them to speed up MTTR (Mean Time to Repair) in order to minimize user impact.
Today’s example was brought to me by a Dynatrace customer at a top US-based insurance company. In his email to me, he relayed the latest Dynatrace Davis story which shows how MTTR has been improved since they are using Dynatrace: “Last Tuesday at 7:28 am, Dynatrace detected an abnormal failure rate on one of our Applications deployed on Glassfish. Turned out that a recent deployment of that app included some malformed SQL that was executed against the backend DB2 running on the IBM AS400 Mainframe. Thanks to the Dynatrace detected root cause information, development could provide a fix that was deployed by 8:12 am. By 8:32 am Dynatrace also confirmed that the problem was fixed for good!”
The customer was kind enough to send me a couple of screenshots, allowing me to re-create the chain of events at his company so you can see for yourself how Dynatrace Davis has transformed the way this customer and his team is reacting to problems.
7:38 am – Dynatrace notifies about Failure Rate Increase
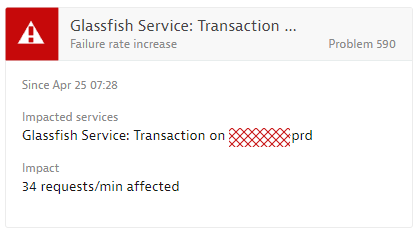
Dynatrace baselines a multitude of metrics across all end users, applications, services, processes and infrastructure. At 7:28 am, Dynatrace noticed an increase of failure rate. To avoid false/positives, Dynatrace’s anomaly detection algorithm keeps observing the situation until it is clear – an abnormal behavior is a real impact on End User Experience or SLAs (Service Level Agreements). At 7:38 am, Dynatrace confirmed the failure rate to be a business impacting issue and opened Problem 590. The problem included context information about the actual impact (34 requests / min), the type of issue (Failure Rate) and listed the impacted service (a Glassfish service running on the named host):
Pro-Tip: The default Dynatrace web service error detection analyzes HTTP Response Codes, e.g: HTTP 4xx, 5xx. This default behavior can be customized to your own needs. A common use case is to let Dynatrace look for Code-Level Exceptions (Java, .NET …) that are thrown, but that the service hasn’t translated into an HTTP Status Code. This capability is really powerful as you can detect failed transaction behavior on code-level vs just on service interface level. If you want to learn more check out the documentation on service error detection rules.
Notify the right people: Once Dynatrace detects a problem, it provides different options to notify users. Standard integrations are through Slack, xMatters, PagerDuty, ServiceNow, our Mobile App or by simply calling a webhook to notify any external tool. Thanks to the context that Dynatrace has about the problem (impacted entity, problem domain, root cause …) you can immediately route a problem to the correct team.
This customer is pushing Dynatrace problems into its HelpDesk system, where new tickets get created and automatically populated with the problem context details. They also recently started using the Dynatrace Mobile App, which provides easy access to problems and their status to Management or anyone else that is interested. If you want to learn more about that story check out our recent blog post Effective AI to Human Interactions with Dynatrace Davis at a large US-based insurance company.
7:43 am – Analyzing Root Cause and Connecting to Dev
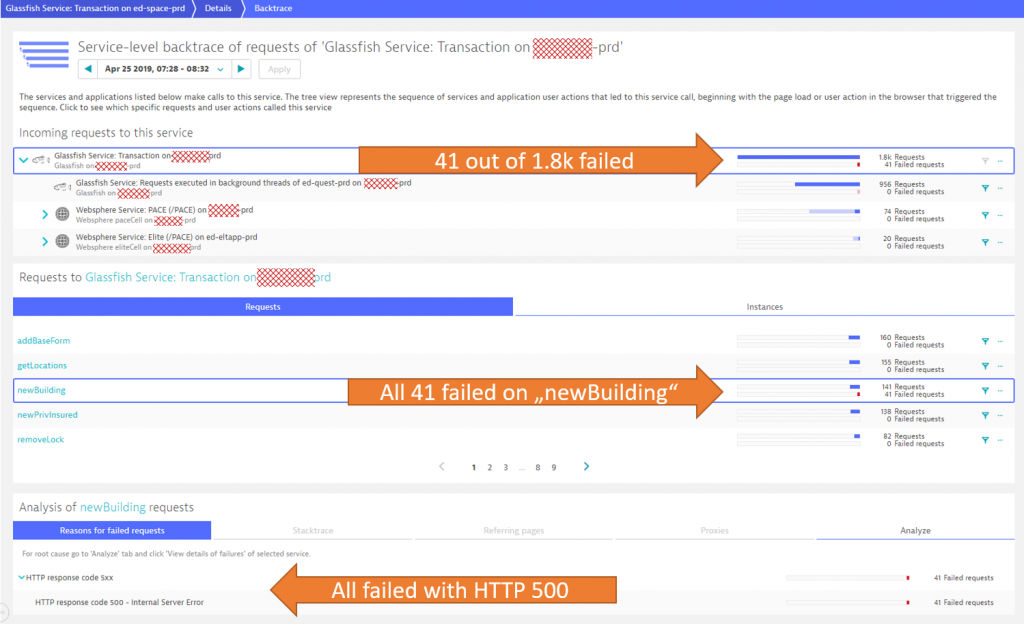
The customer was one of the first responders to the issue. A single click on the problem ticket showed him that the issue only affected one of the many service endpoints – the one for “newBuilding”. The following screenshot shows the Dynatrace Backtrace view – showing how many requests failed, how they are distributed across the different endpoints and which error was actually causing the failure rate increase:
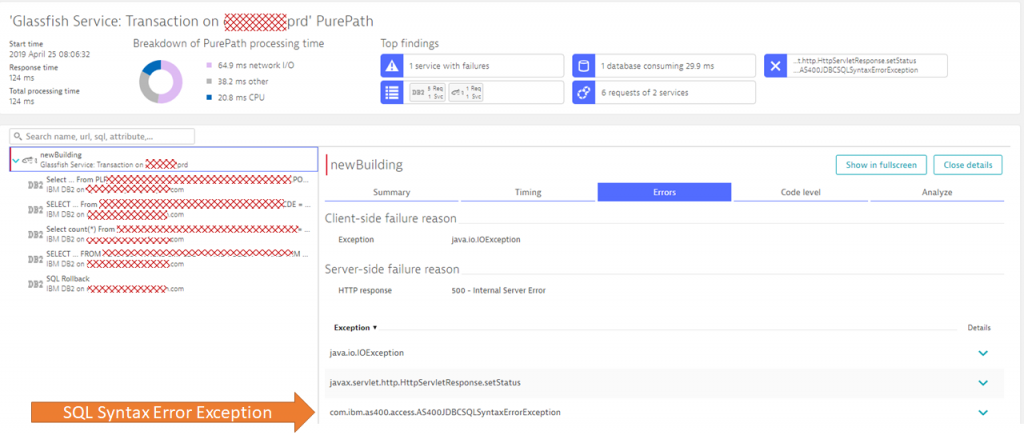
One click in the analysis tab brings us directly to one of the PurePath’s that contained that error. For those of you that are not familiar with PurePath, it is the automated End-to-End Transactional Trace that Dynatrace captures for incoming requests. PurePaths contain lots of context, error and performance information such as URL, HTTP parameters, HTTP Headers, method arguments & return values, SQL statements & bind values, exceptions and more. If you want to learn more about PurePaths, check my Performance Clinics on Basic & Advanced Diagnostics where I give hands-on tips on how to best leverage this data for diagnostics purposes.
For the customer, it was easy to spot the root cause as it is highlighted in the PurePath view. The incoming request to newBuilding made a couple of SQL Calls to the backend DB2 database. One of these calls failing with a SQL Syntax Error Exception (AS400JDBCSQLSyntaxErrorException) which ultimately led to the HTTP 500 Response to the end user:
With all gathered evidence, the customer passed this over to Development!
8:06 am – Development Team is taking over
Dynatrace problem tickets are not only easy to share (simply share the unique link), they also provide a simple, yet powerful comment feature – allowing you to keep track of who is working on a problem ticket.
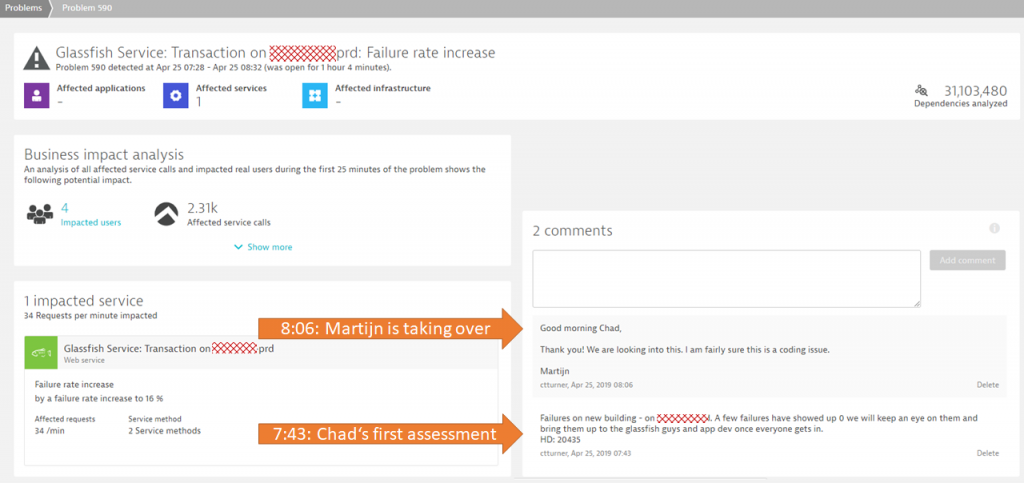
As explained in this blog post – this feature allows this customer to easily communicate status to his management team who is actively looking at Dynatrace problems through the Dynatrace Mobile App. The following shows Problem 590 with two comments posted:
- Highlight that the problem was already analyzed and that it will be brought to the attention of Dev.
- Confirming that this most likely is a coding issue and that the team is working on it.
The Dynatrace PurePath provides an End-to-End trace for developers to immediately understand which SQL statement actually caused the SQL Syntax Exception as you can see in the next screenshot:
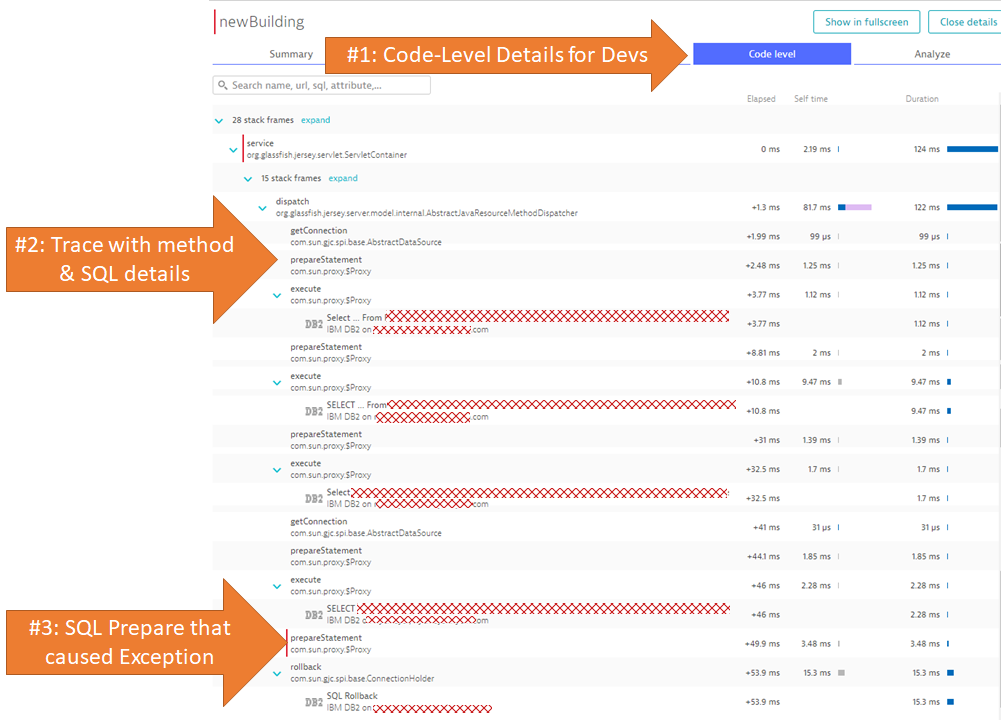
Tip: The Dynatrace OneAgent automatically provides very detailed information on method executions, SQL statements or Exceptions. The screenshot you see above was captured without any additional configuration. In case you want the OneAgent to capture specific method arguments, return values or any other context data you can configure this through a feature we call Request Attributes. If you want to learn more check out my Performance Clinic Tutorial on Mastering Request Attributes.
8:12 am Deploying the fix
Only a couple of minutes later the development team was able to provide a fix that was immediately deployed. A couple of manual test runs validated that the fix worked as expected.
8:32 am Fix Confirmed – Problem Closed – User Impact Prevented!
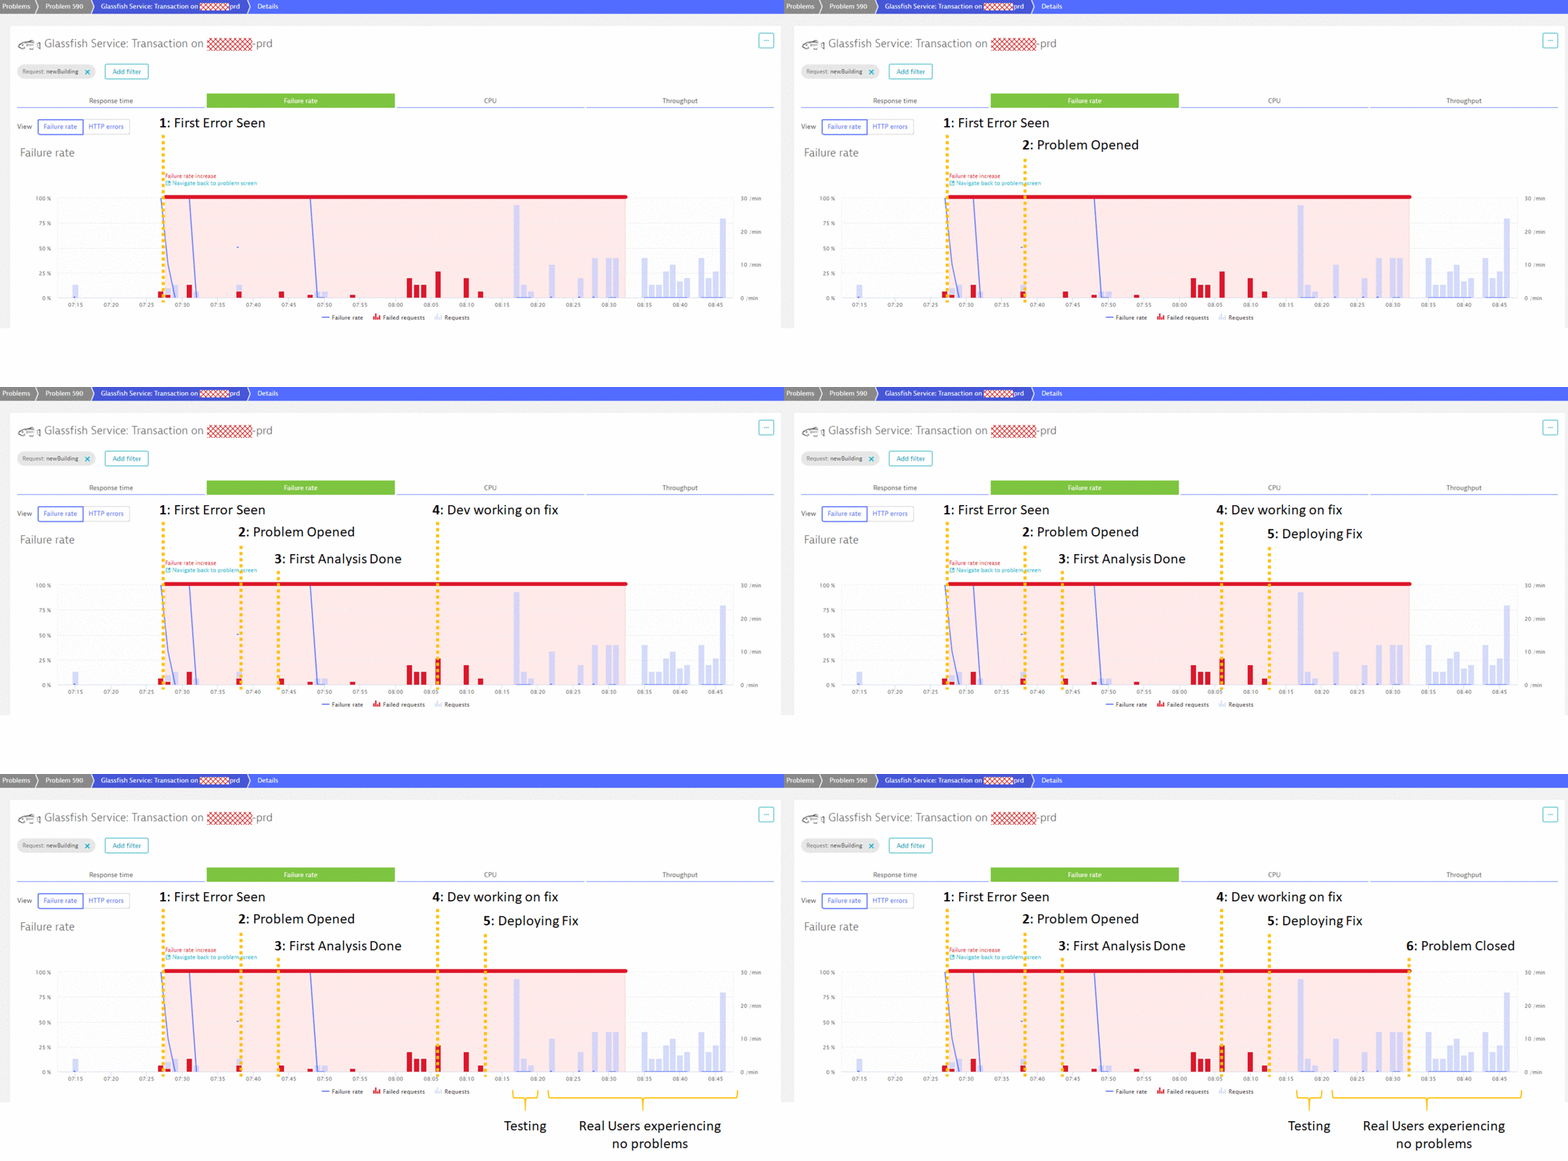
As real user traffic started to pick up just after 8 am, it was clear that the fix also worked as expected for real user traffic. That’s why Dynatrace closed the problem at 8:32 am, sending notifications to HelpDesk that the team did a good job. At the same time Management got the notification through the Dynatrace Mobile App that their teams have done a great job and fixed a problem before the big rush of users came in. The following shows the timeline of the problem and the key milestones from detection to fixing it:
Conclusion: First Class Incident Response
While I want to give Dynatrace a lot of credit for detecting that problem fast, the credit goes back to the customer. This team has optimized its processes to respond to abnormal behavior, and with that dramatically improved MTTR (Mean Time to Repair). It has
- Rolled out Dynatrace OneAgents across their infrastructure for true FullStack Monitoring
- Integrated Dynatrace Davis into their Incident Response Processes
- Enabled Management for Self-Service Status Checks
- Prevented negative impact for End Users
If you want to learn more about Dynatrace check out my Dynatrace OneAgent YouTube Playlist where I give practical tips on how to use Dynatrace in different scenarios. I hope you also feel encouraged by this story to share your own. If you want to share – simply drop me a note!


Looking for answers?
Start a new discussion or ask for help in our Q&A forum.
Go to forum