Validating Deployments still seems to be a semi-automated task for most software delivery teams. Why do I say that? Because we analyzed the results of our Autonomous Cloud Survey and sat down with a handful of these companies that provided answers to questions such as: What’s your Commit Cycle Time? or What’s your Maturity of Delivery Automation?
In one example of a US national bank the average manual time spent to validate the quality of a deployment before it can go to production was 12.5 days and therefore contributing > 90% of the overall Commit Cycle Time! Most of the time is taken by quality or release engineers looking at test results, comparing them with previous builds or walking through a checklist of items that accumulated over the years in order to harden their release acceptance process.
At Neotys PAC 2019 in Chamonix, France, I presented approaches on how to solve this problem by looking at examples from companies such as Intuit, Dynatrace, Google, Netflix, T-Systems and others. You can read my blog supporting my session titled “Performance as Code: Lets make it a Standard” on the Neotys PAC blog. The outcome of the presentation and the follow up discussions at Neotys PAC lead to Pitometer!
Introducing Pitometer: Metrics-based Deployment Validation in your CI/CD
Pitometer is a Node.js OpenSource project which is part of keptn and it provides a good solution to automate the validation of a software deployment based on a list of indicators resulting in an overall deployment score. A single indicator is defined as a query against a data source such as a monitoring, testing, security or code quality tool. The result is graded against thresholds, baselines or previous results. To calculate the overall deployment score you can define a list of Indicators, give each indicator a maximum score (=weight) and define the total score a deployment must achieve in order to be considered passed!
The following shows how to evaluate a deployment score based on metrics from Prometheus and Dynatrace. On the left you see the Pitometer spec file with the list of indicator definitions as well as the total scoring objective. When executing the validation, Pitometer
- Queries the results through the defined data sources (Prometheus & Dynatrace)
- Grades the results by passing it to the Grader (in this case a Threshold grader)
- Calculates the total deployment score
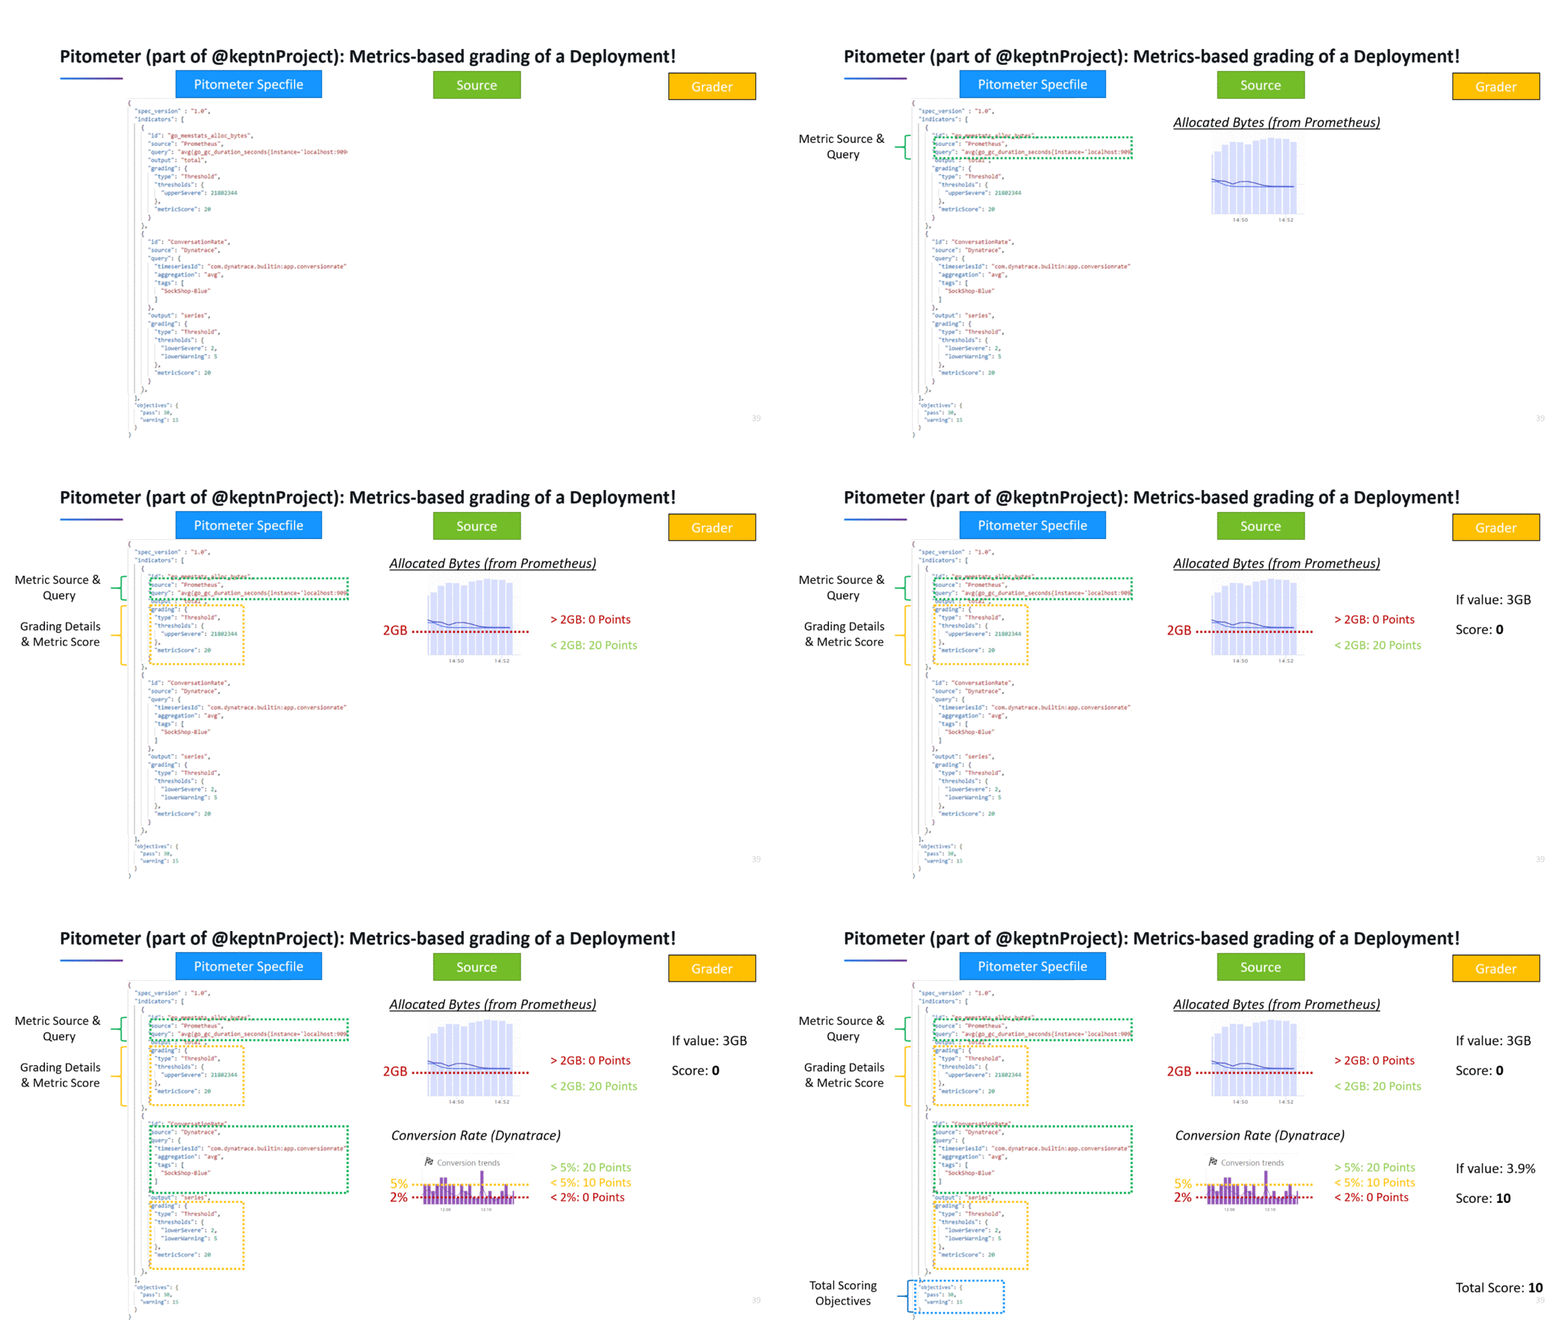
Pitometer has been architected to be extensible for both data sources as well as graders. In my Neotys PAC blog, I cover more details on which other data sources we can include and what type of grading algorithms I would like to see in the future. Neotys and T-Systems MMS are amongst the first companies to build extensions.
Good news is that Pitometer is ready to be used – and ready to be extended. If you want to use it there are two options:
- As part of keptn’s Deployment Evaluation Workflow
- Standalone: call it from your existing delivery pipeline
#1: Pitometer in keptn
If you haven’t heard about keptn – well – let me give you a quick intro. Keptn is the open source control plane for continuous deployment and automated operations for cloud native applications on Kubernetes. It takes your artifacts (e.g: docker containers), and orchestrates multi-stage direct, shadow, dark, blue/green or canary deployments. At its heart it uses Istio (for traffic control) and Knative (for event driven tool orchestration) and stores all configuration in Git – following the GitOps approach. Pitometer is used to validate a deployment after it was successfully tested based on the defined testing strategy. If you want to give it a try simply follow the instructions in the keptn docs.
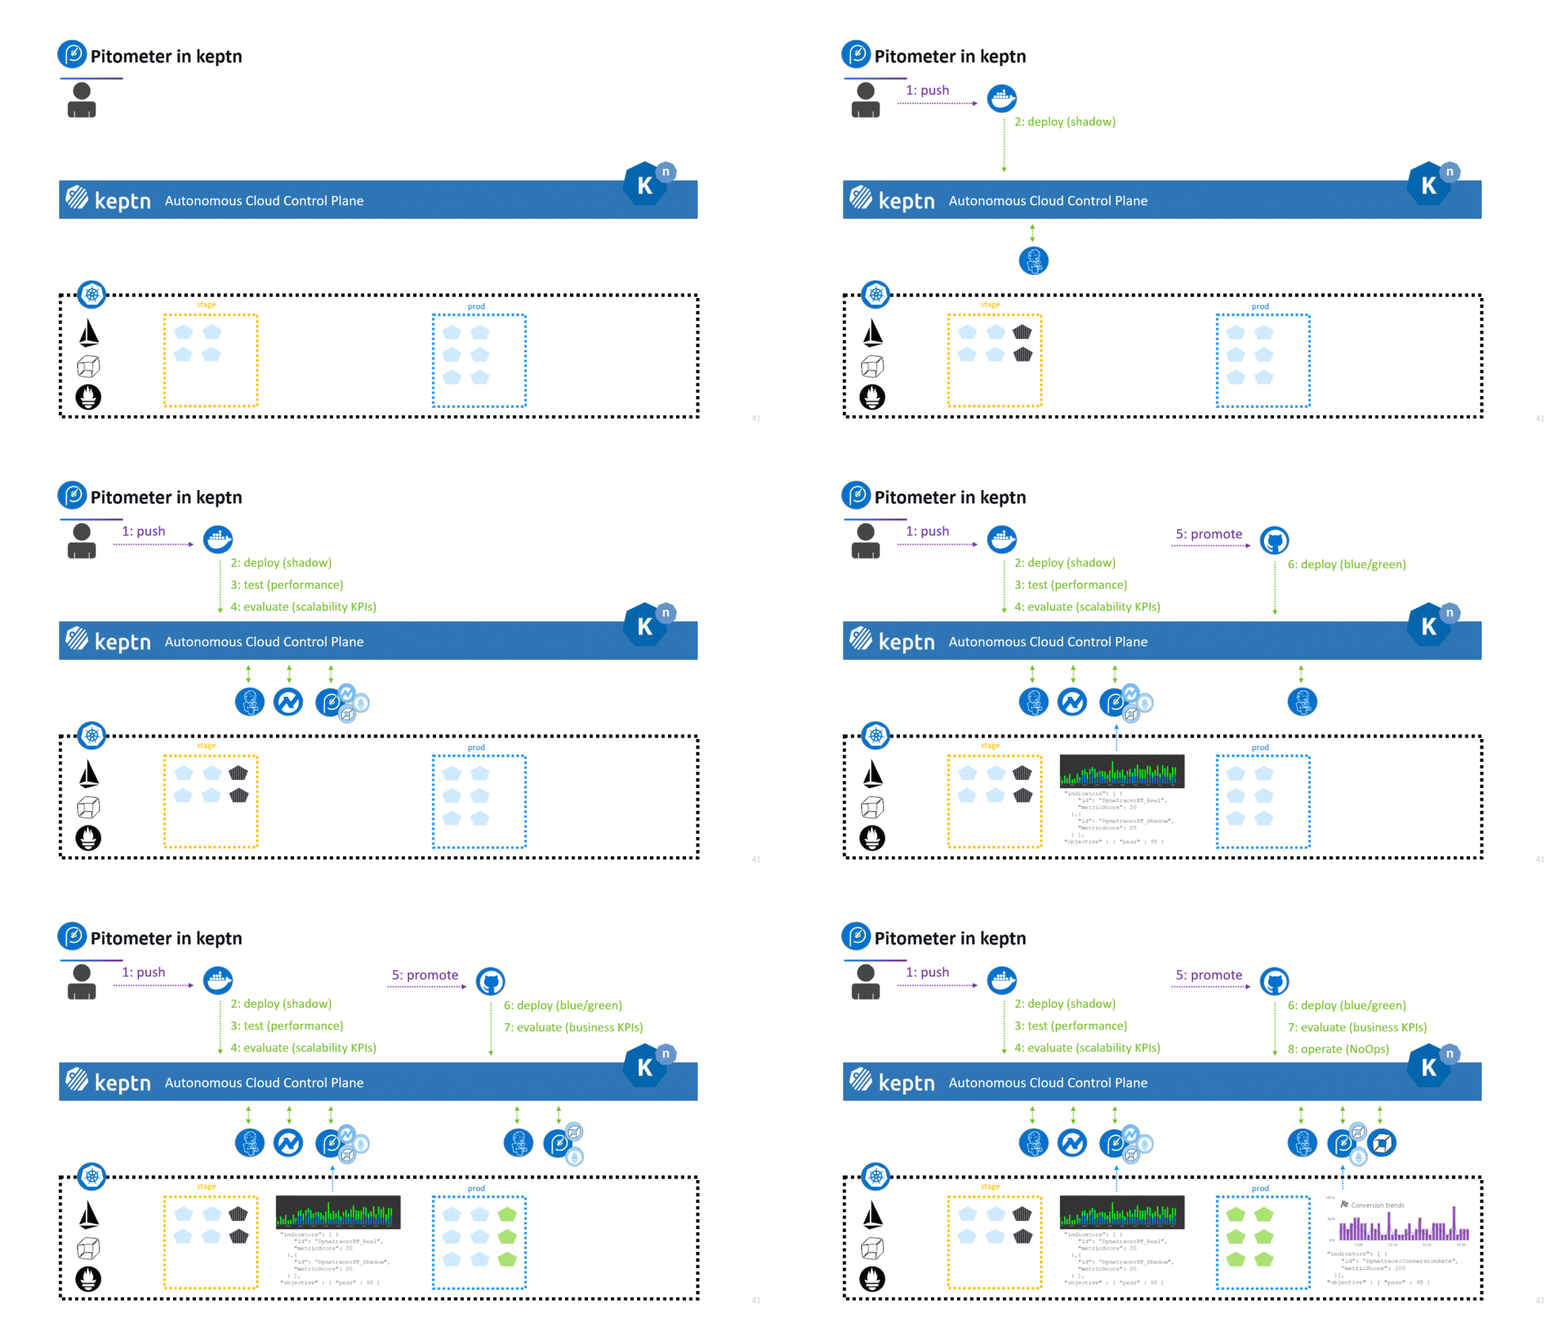
As of right now, keptn is officially supported on certain Kubernetes deployments (e.g: GKE). The open source community and the team at Dynatrace that drives this project is already working on support for OpenShift and other Kubernetes services such as AKS, PKS & EKS.
If you want to contribute check out the keptn community site on GitHub, follow @keptnProject, or join the keptn Slack Channel or send the team an email via keptn@dynatrace.com!
#2: Pitometer Standalone
Pitometer is set of Node.js module libraries that you can start using in your own environment and pipelines. Following animation shows the sample code from the Pitometer GitHub repo and which result it produces:
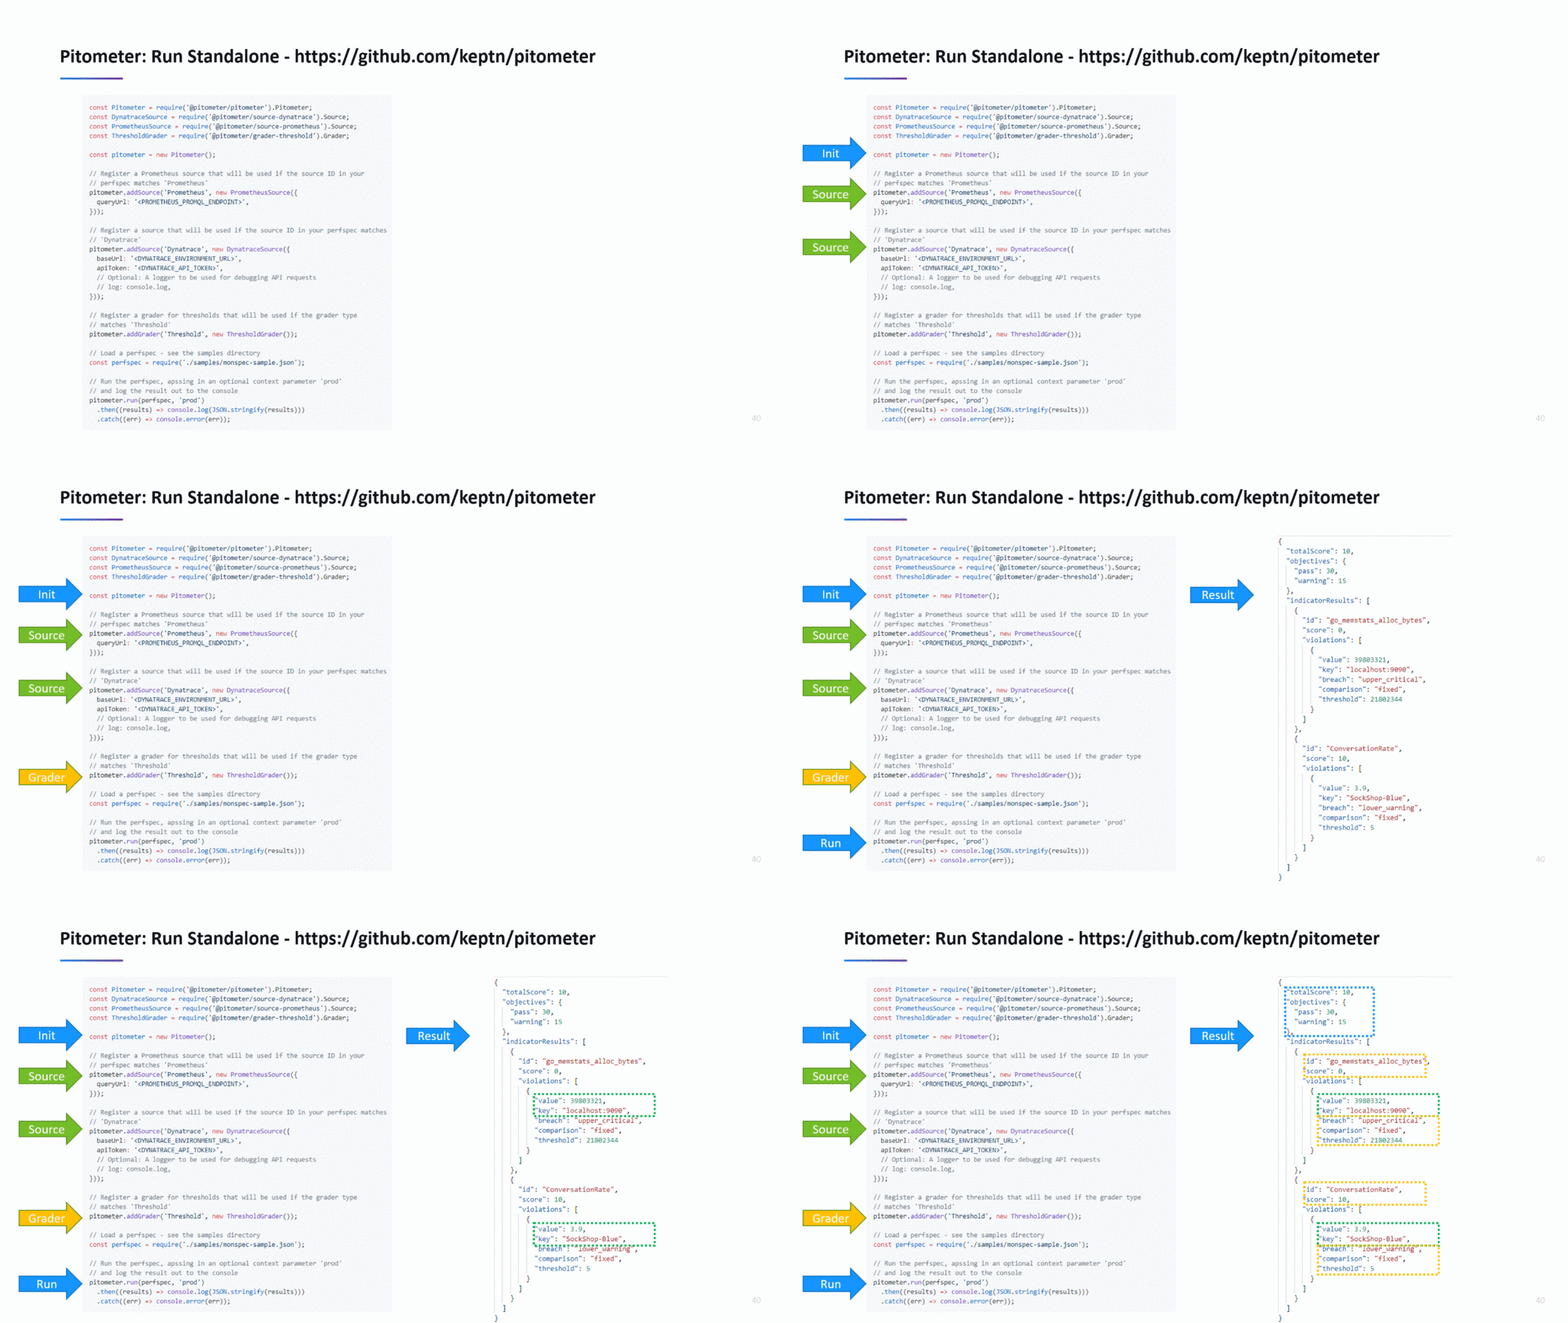
If you want to automate deployment validation based on metrics or data from tools that you already use in your CI/CD pipeline give Pitometer a try. If there is no Pitometer source implementation available for your tool no worries – check out the reference implementations of Dynatrace or Prometheus and see how easy it is. Alternatively feel free to put in a feature request on the Pitometer project.
I am also working with some of our Dynatrace customers that are using Bamboo to deploy their monolithic applications. They also have the need to automated deployment validation and are now also leveraging Pitometer as it allows them to pull in data from Dynatrace which is monitoring their test and production environment and use that for automated quality gates!
You can also checkout an open source web microservice app and an Azure function app that utilize the Keptn Pitometer Node.js modules to gather and evaluation a provided time frame and performance specification. These were developed by my colleague Rob Jahn and Daniel Semedo from Microsoft. You can learn more and get the links to the source code in his blog, Adding automated performance quality gates using Keptn Pitometer
Beyond basic metrics: Detecting Architectural Regressions
At the recent DevExperience conference in Iasi, Romania I presented on Top Performance Challenges in Distributed Architectures. I gave real life examples on N+1 Query, N+1 Call, Payload Flood, Too Tightly Coupled and a list of other architectural patterns. I concluded that most of these patterns can be automatically detected by analyzing data and metrics from monitoring or testing tools.
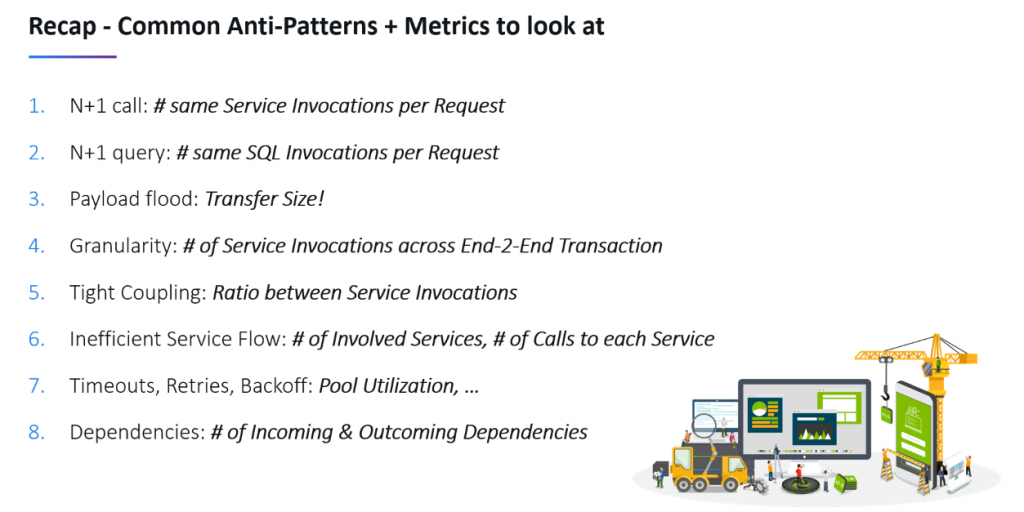
In that presentation I also talked about Pitometer and how we can use it to automatically each of those common architectural regression that lead to performance and scalability problems – right within your CI/CD pipeline!
The Dynatrace Pitometer Source for instance not only supports queries for Dynatrace Timeseries Data such as Response Time, Failure Rate, CPU, Memory … – it also supports to query Smartscape Metrics such as Number of Incoming and Outgoing Dependencies, Number of instances a Service runs on, and more!
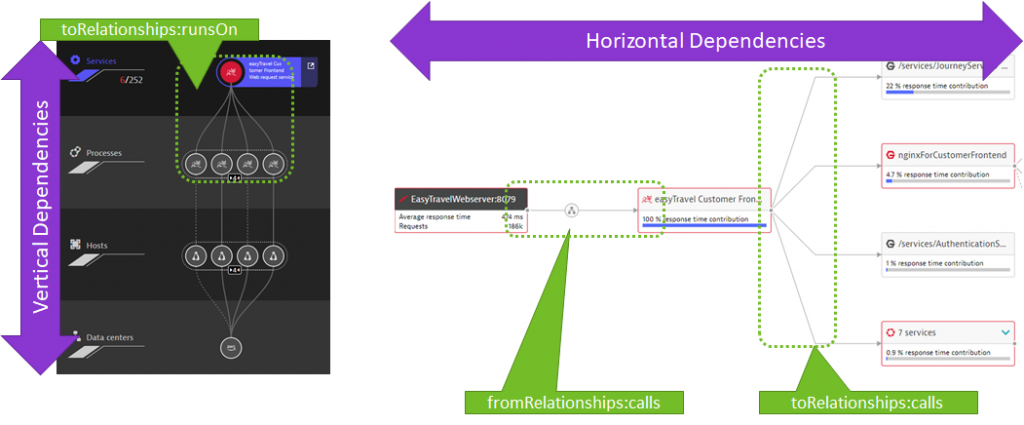
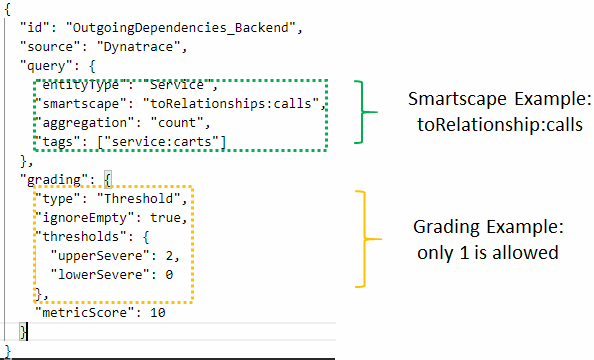
On the Pitometer GitHub project you find a sample perfspec-sample.json that includes samples for the Smartscape dependency metrics. The following shows how to evaluate the number of outgoing dependencies to e.g: ensure that your service has only outgoing dependencies to a single backend service. If a code or configuration change would add a new dependency the validation would fail:
Help us make better deployment decisions
Pitometer and keptn drive the path towards better automated deployment decisions. While Dynatrace is currently driving most of the innovation we are happy to see other companies such as Neotys, T-Systems, AWS, Microsoft … already contributing to it. We invite all of you – small startup, large enterprise, schools or universities – to use these projects and help us improve it by contributing to it.


Looking for answers?
Start a new discussion or ask for help in our Q&A forum.
Go to forum