As adoption rates for Azure continue to skyrocket, Dynatrace is developing a deeper integration with the Azure platform to provide even more value to organizations that run their businesses on Microsoft Azure or have Microsoft as a part of their multi-cloud strategy.
With rich offerings available in platform services and the growing popularity of serverless application architectures, new challenges in monitoring have emerged. The lack of operational insights can make it much harder to interpret the root-causes of detected application issues.
Deeper visibility and more precise answers
In addition to providing AI-powered full-stack monitoring capabilities, Dynatrace has long featured broad support for Azure Services and intuitive, native integration with extensions for using OneAgent on Azure. Our integration of Azure Monitor allows for the next level of visibility into the platform’s behavior, providing precise, AI-powered answers from deep within the service layer.
The long way home
Say you have a Dynatrace-monitored application that uses Azure Service Bus queues, and you observe degradation in response time caused by the queue. To investigate the issue with the queue, you have to switch to the Azure Portal and dig further into Azure Monitor.
The short way home
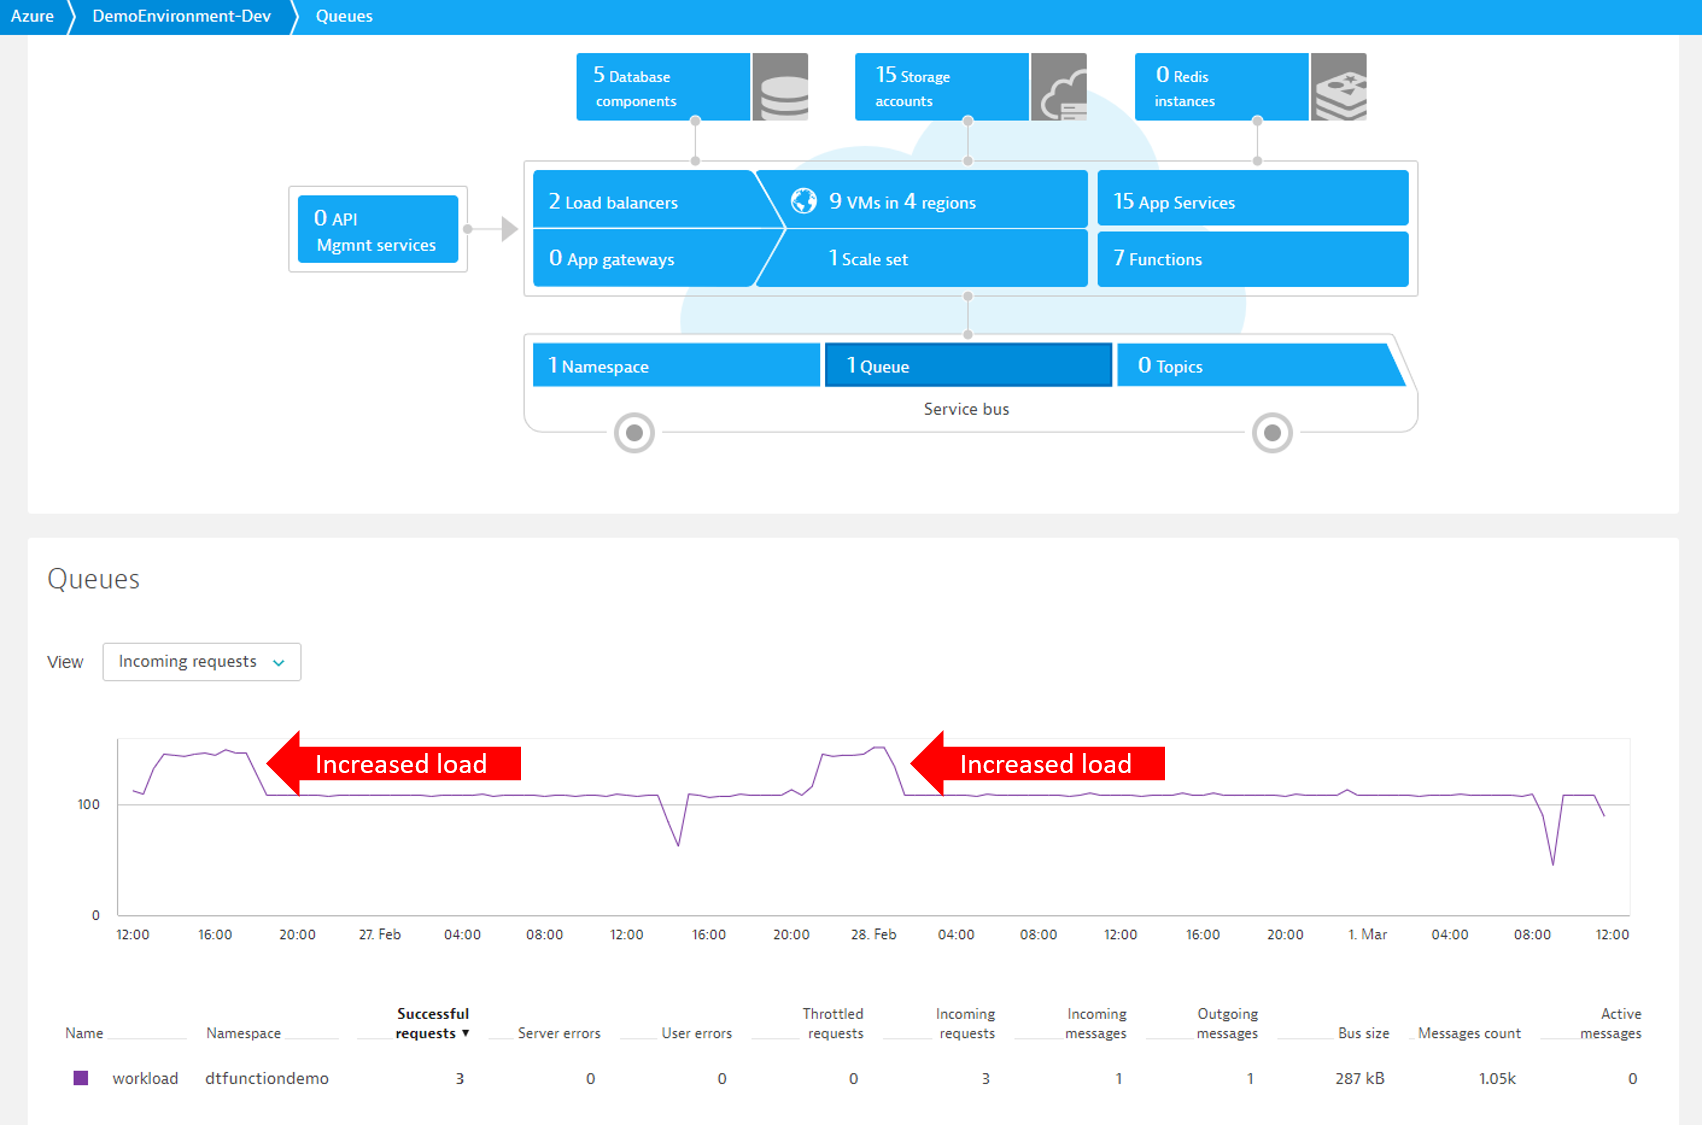
With Dynatrace Azure Monitor integration enabled, Azure service metrics are just a click away. Dynatrace automatically explores all Azure services and captures their metrics, which can then be viewed on an out-of-the-box Azure overview page (see example below). This page provides you with easy access to an overview of your Azure environment, with no additional effort.
By navigating to the overview page of your monitored Azure environment and clicking the Queues tile in the infographic, you might see that, for example, your application is running into throttling issues whenever there’s a higher load on the application and you have to scale up your figure service tier (see examples below).


More than just metrics
Manage resources with Dynatrace and the Azure Resource Manager (ARM)
The new capabilities for monitoring Azure Monitor metrics also include integration with the Azure Resource Manager (ARM). Independent of OneAgent, you can utilize the Dynatrace API to explore provisioned Azure resources and provide holistic monitoring, both of which further support operation-focused teams.
- Automatic discovery of subscriptions and resources with full access control through Azure Active Directory from a single resource up to the account level
- Capture of additional Azure metadata, which is important for correlation and other uses
- Capture of complementary service metrics from Azure Monitor
- Automatic handling of API request throttling to support large-scale environments
- OOTB dashboard for a quick overview
- Supported services
- Virtual machines
- Virtual machine scale sets
- Azure application services
- Azure functions
- Load balancer
- API management
- Application gateway
- Redis Cache
- SQL Azure
- Service Bus queues and topics
- Storage blobs, tables, queues, and files
What’s next
- Integration of PaaS services into Smartscape, enabling additional services and metrics to be considered by the Dynatrace AI (Davis®)
- Azure alerts in Dynatrace
- Continuous expansion of support for additional services


Looking for answers?
Start a new discussion or ask for help in our Q&A forum.
Go to forum