Synthetic monitoring is typically used for service level and availably monitoring of your critical websites, pages and user journeys. That was also the initial use case for a Dynatrace customer in a large, US-based insurance company, as he explained to me in an email he recently sent me. “Our company utilizes Dynatrace Synthetic Monitors to ensure core applications are up and running both for our staff and our insured customers. These Synthetics monitors do a fabulous job of testing out site, logging in, provide availability metrics for management and waterfall analysis of each test and action, all with the ability of alerting us when availability is compromised and or the user is experiencing degradation. This is a very powerful feature that helps us provide that exceptional customer experience that all companies strive for.”
He continued: “We wanted to take this idea to the next level and not just only test and collect data on our customer experiences, but why not on our industry competitors. Well, we did just that! I personally use two insurance providers that are competition for my company. I set up two separate Synthetic Monitors pointing to the login pages of our two main competitors. I supplied my credentials to Dynatrace and ensured that these two new Synthetic Monitors were identical to our current monitor. (Locations and Frequency)”
He concluded: “Dynatrace has allowed us to synthetically test our competitors whenever we want to ensure that we continue to provide that top-notch customer experience that all customers expect. And in the event that my company fails to outperform a competitor, we now have that Waterfall Analysis that App Dev and the Web Developers can analyze to provide a better experience while giving staff that critical insight and ideas of how these customer pages can load based off of our competitors.”
Awesome use cases! Now – let me show you how the customer is actually doing all of this with Dynatrace, so that you can replicate this for your business-critical websites!
Step #1: Monitoring your own key end user scenarios
If haven’t used Dynatrace Synthetic yet, I suggest you do so. If you don’t have a Dynatrace tenant, you can simply sign up for the 15 day SaaS-based trial which also includes Dynatrace Synthetics.
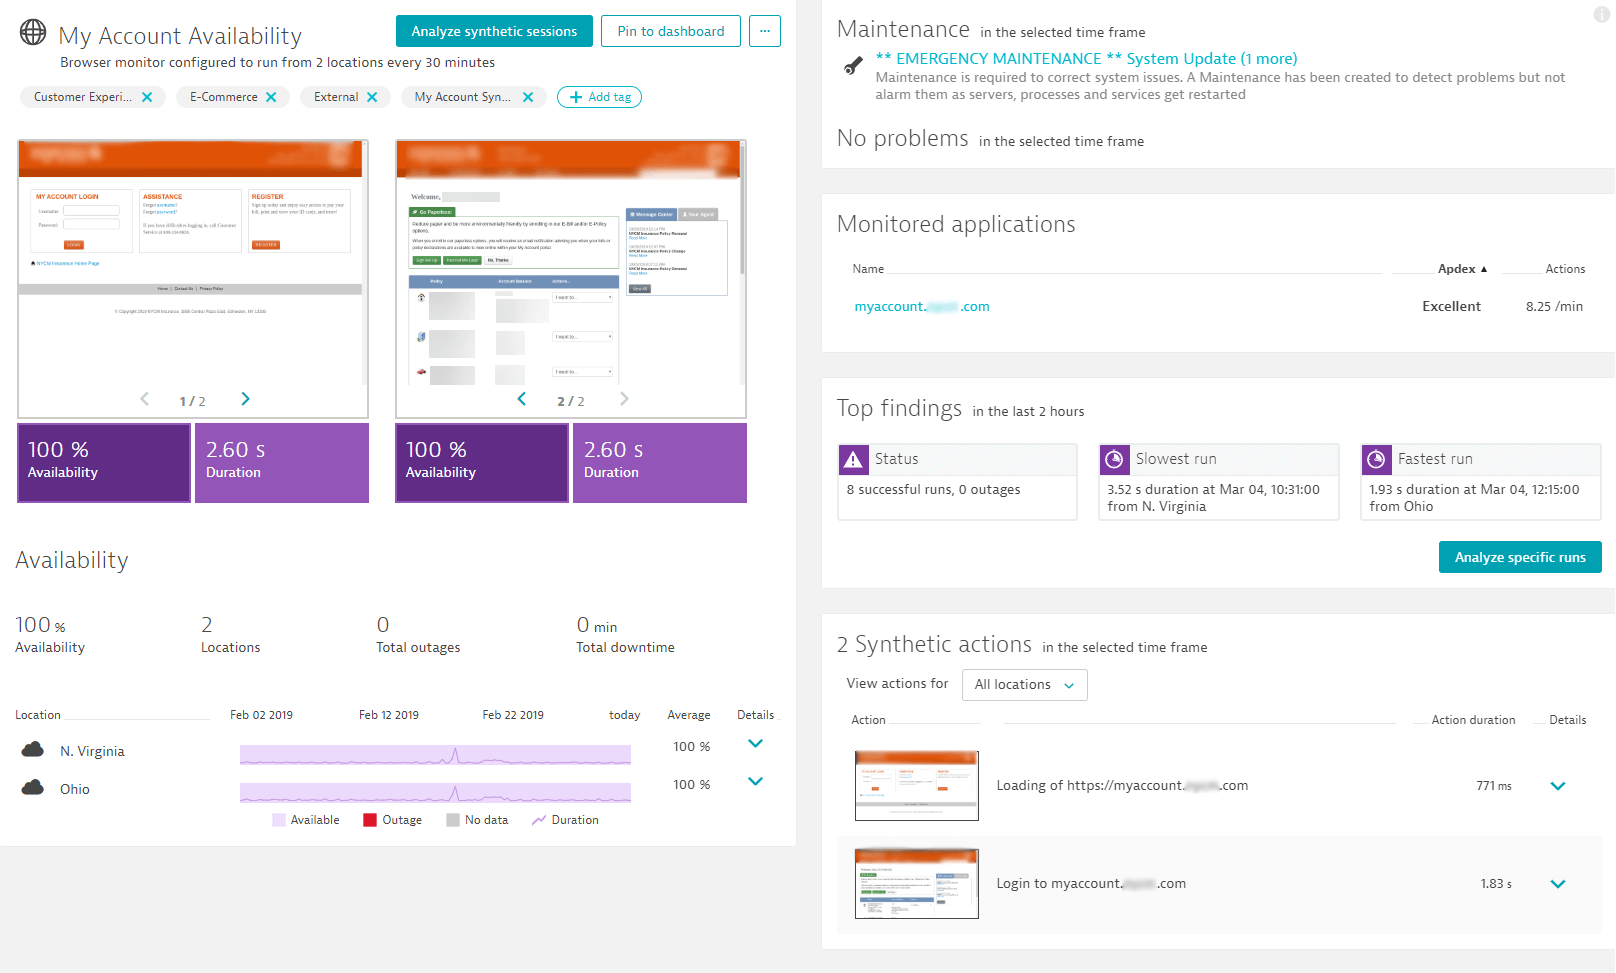
As the customer explained in his email, he recorded a browser click path test that is first loading this company’s website and then login. He then selected to run this test from two of our synthetic test locations, which resemble key geographical regions for their business. The following screenshot shows how Dynatrace visualizes the collected synthetic data, how it gives you screenshot visualization of every step, highlights top findings and allows you to drill into the details of every test execution and step:

Tip: To learn more about locations, simulated browsers or bandwidth simulation, check out the documentation on Configure a browser monitor. And if your websites might not be accessible from the internet, you can also look at our Browser monitors in private location capability.
Step #2: Optimizing your own Page Load Times
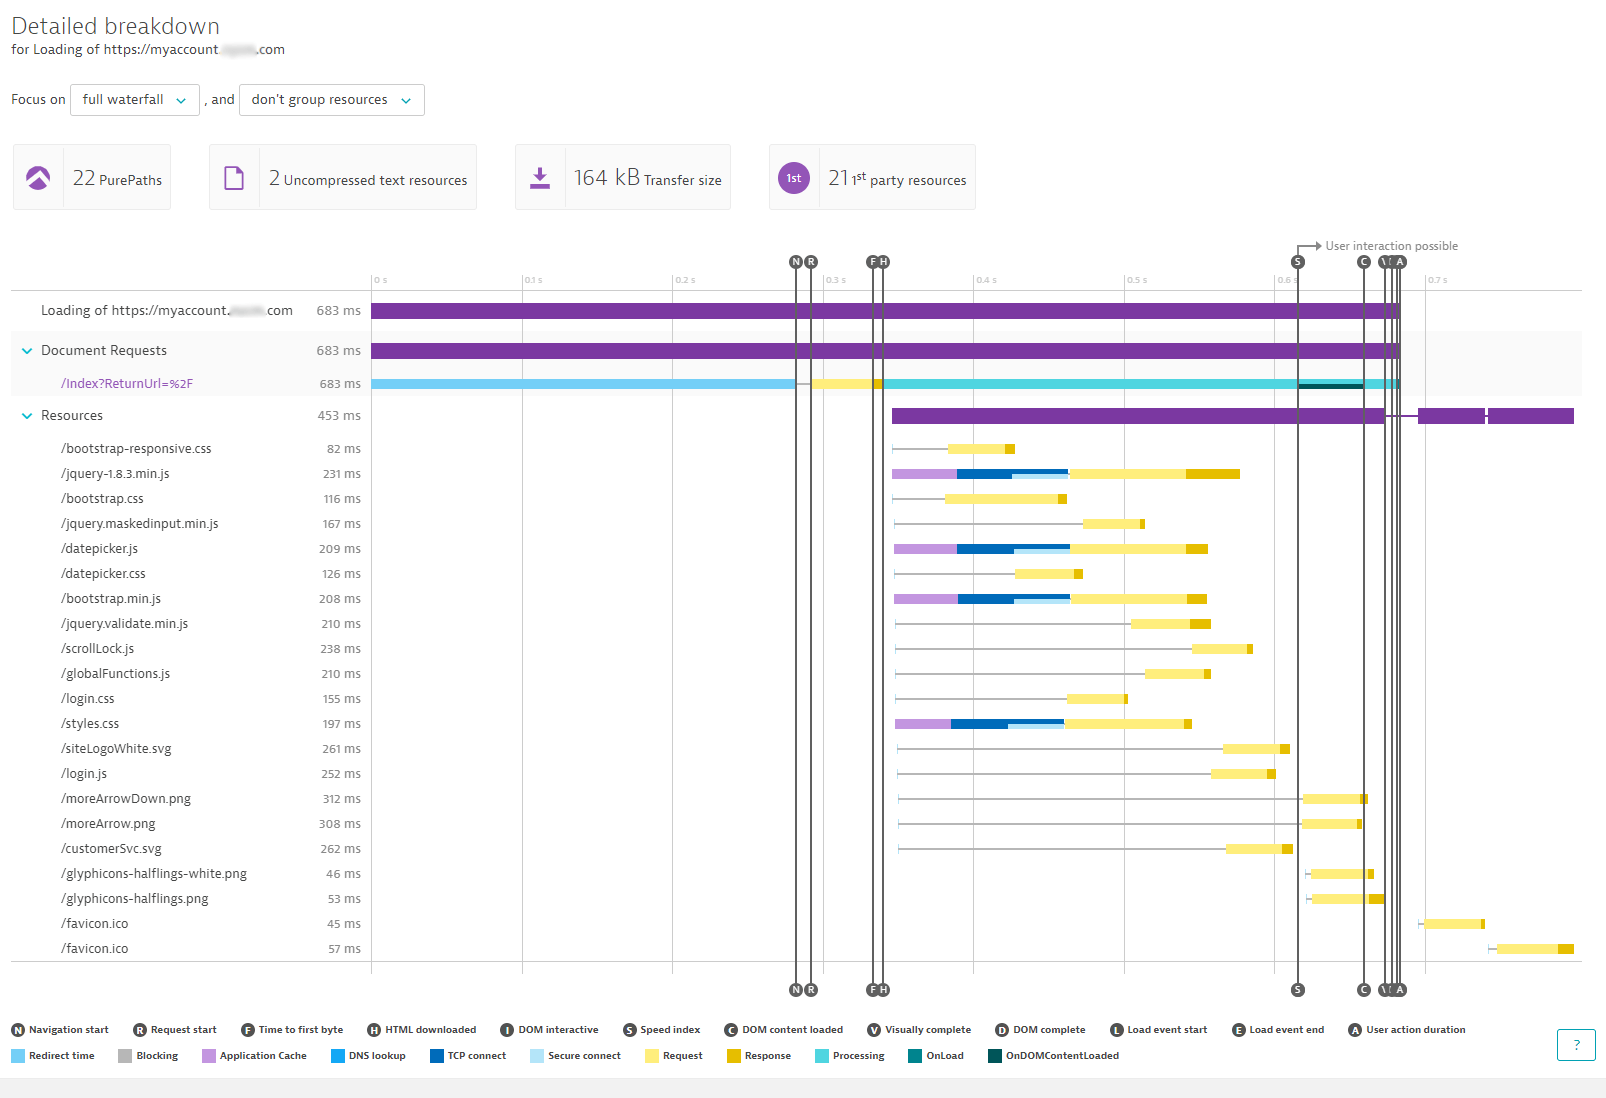
Just as Dynatrace Real User Monitoring (RUM) does for your real end users accessing your web & mobile applications, Dynatrace Synthetic gives the same level of waterfall analysis for the synthetic test executions. This company uses this level of detail to optimize their web page performance on a continuous basis. The following screenshot shows the level of detail their web developers get. It is the same detailed information they receive from the browser built-in diagnostics tools – but in this case it comes from the synthetic test executions from the different geographical regions. A great way to learn how pages & resources load differently from different regions, different browsers, different bandwidths:

Tip: Hover the mouse over the individual resources in the waterfall to access all captured W3C Resource & Navigation Timings. This gives you good insights into DNS, connection time or sizing issues of these resources.
Step #3: Setup Synthetic Monitors for your Competition
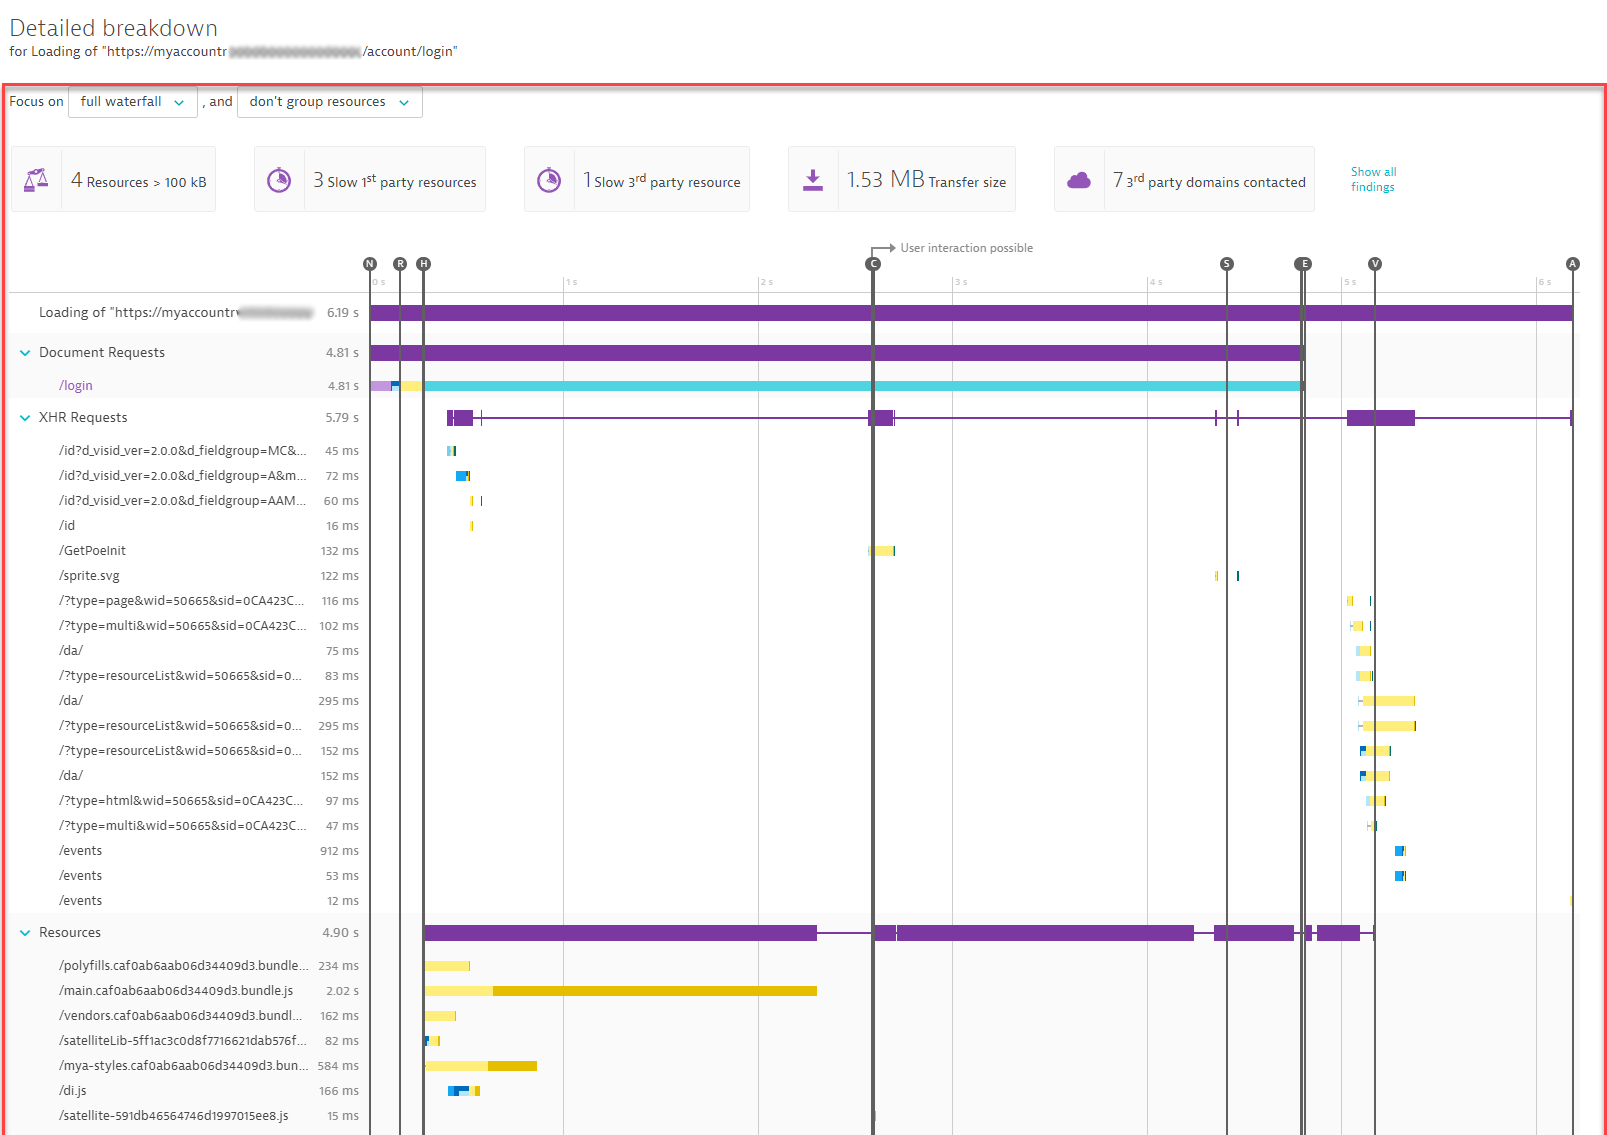
As the customer explained, he was setting up similar synthetic tests for their 2 main competitors. They are not running these tests all the time, but run them from time-to-time to make sure they are not falling behind the user experience delivered by their two closest competitors.

Tip: You can define multiple Synthetic Tests and can set them active or inactive. This is what the customer is doing. They are running the Synthetic test against their own website 24/7 as they also leverage the automatic alerting in case there is an outage or a performance degradation. The tests against their competitors’ sites are executed less frequent.
Step #4: Analyze and learn from your competition
As every synthetic test provides full waterfall analysis, the web developers at a large US-based insurance provider can also learn from their competitors engineers. Simply analyze their page structures, how they load their JavaScript files or images, which CDNs they are using …

Step #5: Celebrate your Wins!
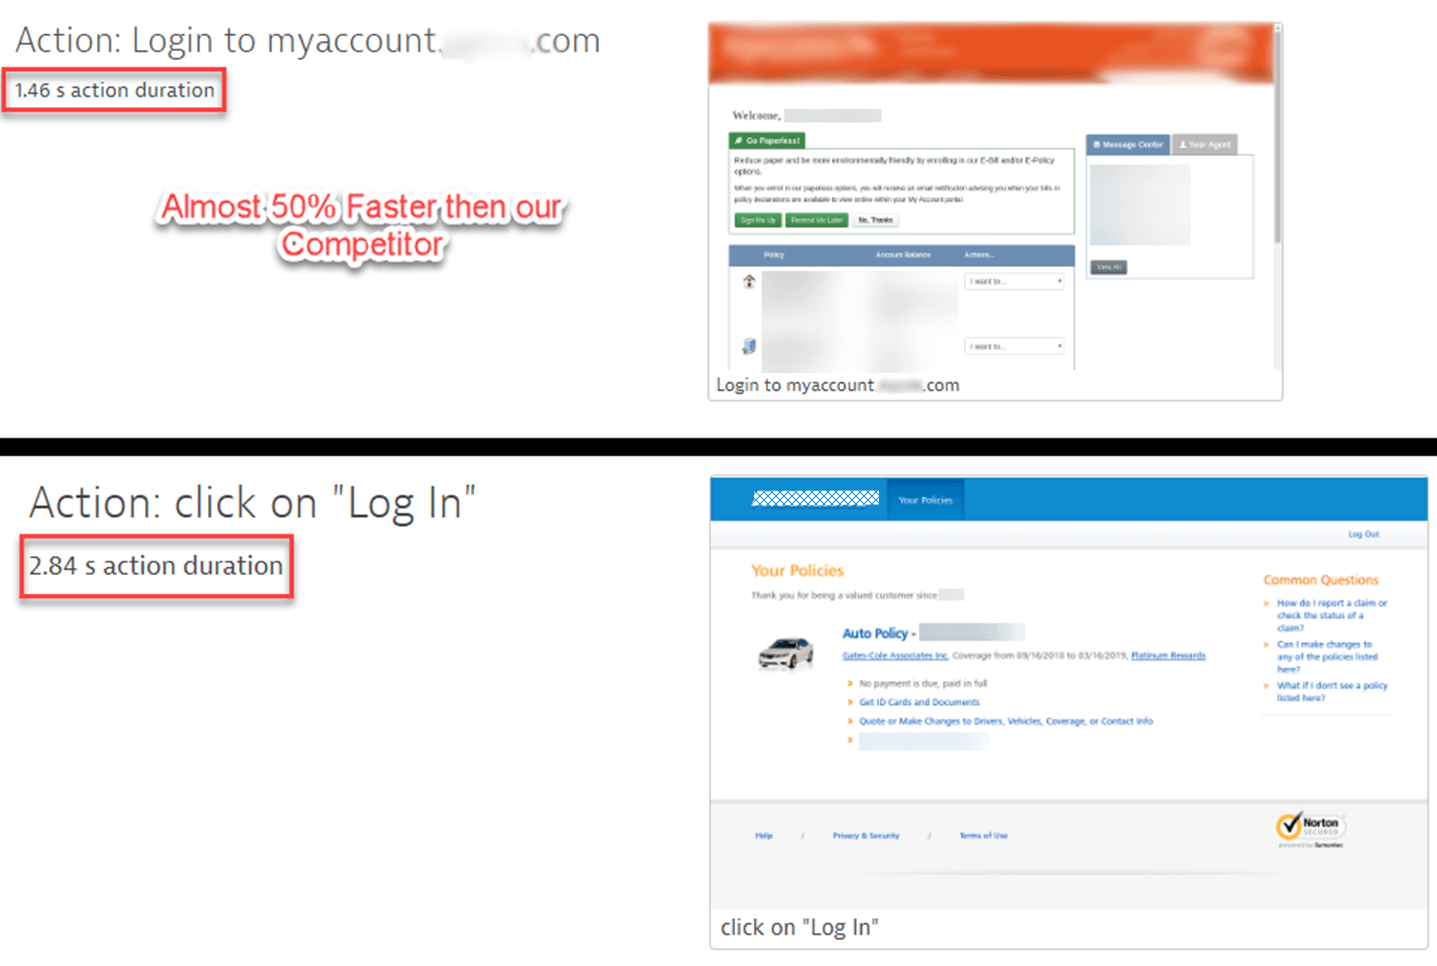
If the continuous effort to optimize page load times, page sizes, availability … leads to outperforming the competition, it is time to celebrate! The below screenshot is an example of what the customer sends to him team when Dynatrace tells them that their critical pages critical pages (such as login), are clearly faster than their main competitors:

Now its time for you to compare yourself!
A big thank you goes to this customer, who keeps feeding me with these great use cases and stories. Make sure to also check out the previous story he told me around Modern Windows Workstation Monitoring with Dynatrace.
I hope this blog got you curious about how you compare against your competition. As you could see, Dynatrace Synthetic makes it really easy. Start today by signing up for your Dynatrace Trial, setting up your first synthetic tests, optimize your own page and then continuously compare against your competitors.


Looking for answers?
Start a new discussion or ask for help in our Q&A forum.
Go to forum