Dynatrace monitors the response time, failure rate, and throughput of Oracle database statements executed by your applications. You can immediately see which statement is responsible for a slowdown, find the N+1 issue, analyze failed requests, and much more. Now we’re adding Oracle infrastructure metrics so that you have more data for analyzing the root cause of problems related to your Oracle database infrastructure. As always, all monitoring data is displayed for you in context and analyzed by Dynatrace AI. Dynatrace automatically creates the connection topology from the application layer to your Oracle database servers.
Understand the performance of your Databases
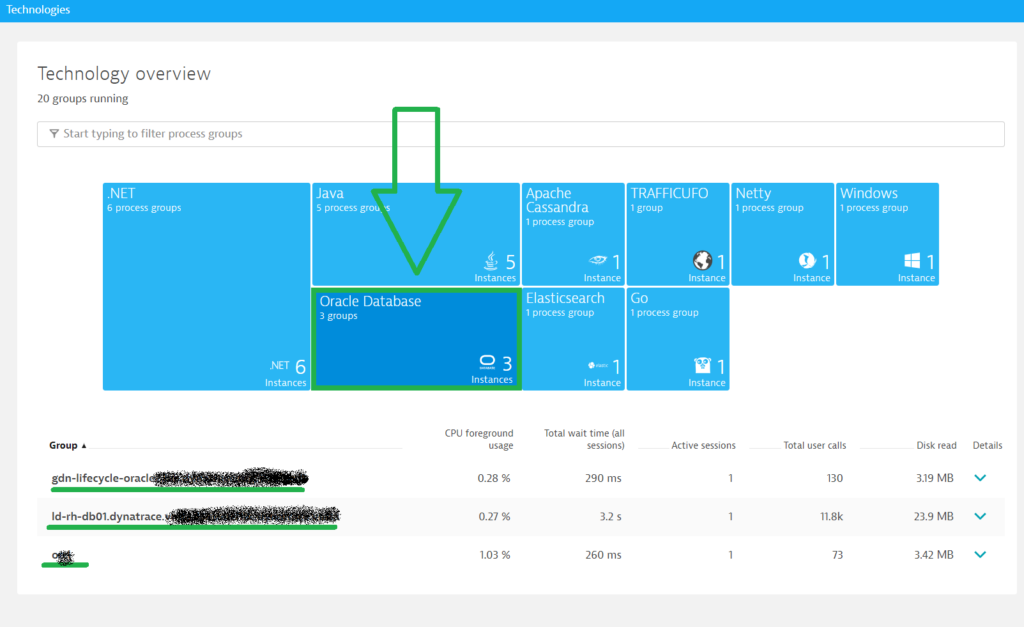
To find your Oracle servers, select Technology overview from the Dynatrace navigation menu.

Here, you can compare your Oracle databases against one another and select individual databases for in-depth analysis.

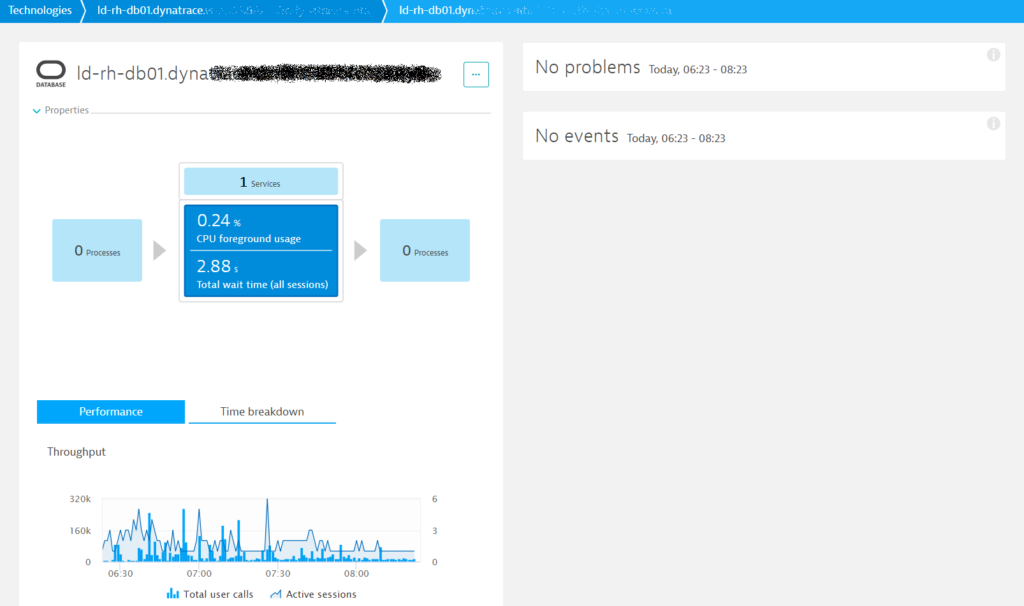
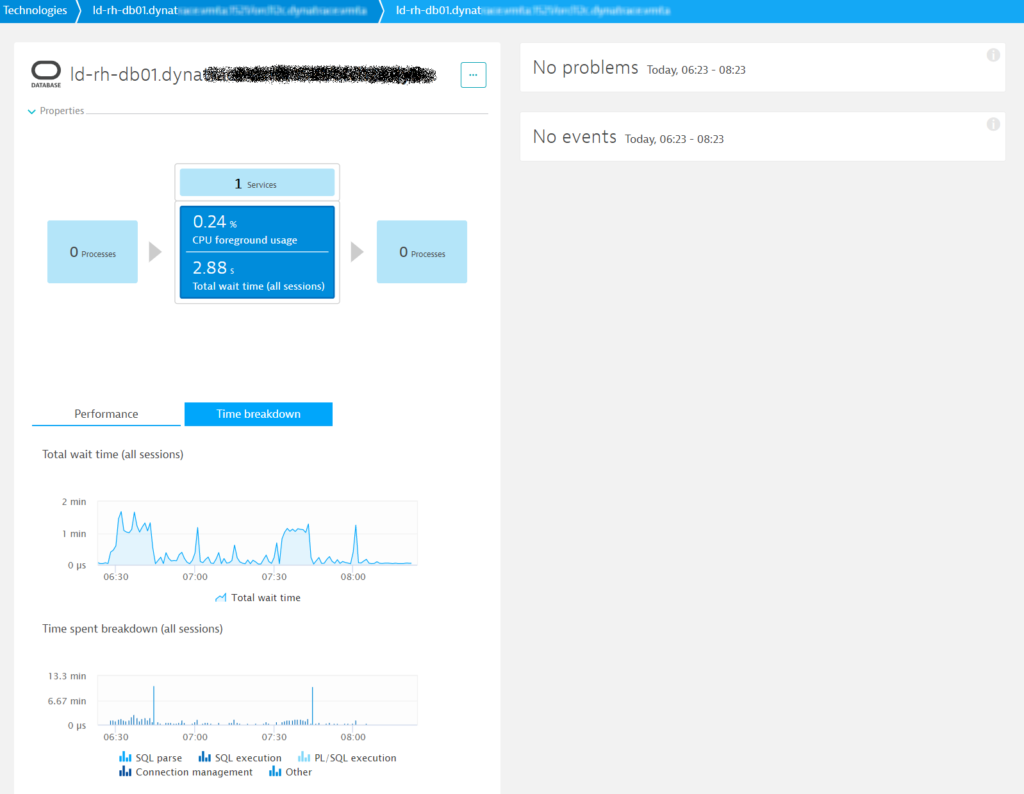
When the number of active sessions starts to hit the ceiling, check your infrastructure metrics to see how your Oracle hosts are performing. If you find that host performance is fine, there are a few other limits that may come into play when determining the number of connections an Oracle database supports. Check the sessions in v$parameter and the connection pool limits in the application layer. A stable number of user calls while CPU usage grows may indicate performance problems. In such cases, select the Time breakdown tab (see example below).

Check Total wait time and analyze the Time spent breakdown. If you have high SQL parse time, use bind variables to leverage SQL caching. High SQL execution time may indicate that heavy statements are the root cause of poor performance.
Stay tuned for more enhancements as we’re now working on a Slowest statements page.
How does it work?
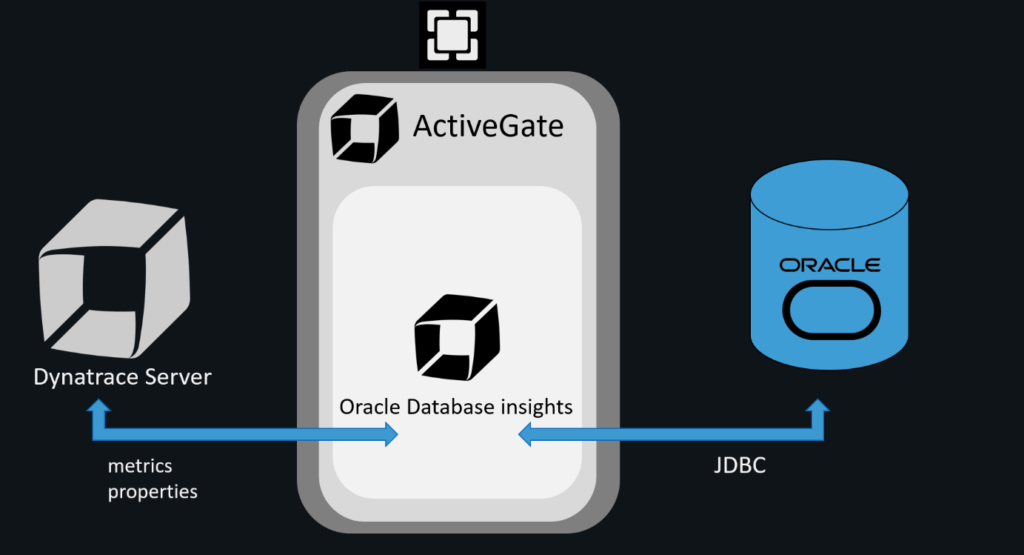
Database insights run inside ActiveGate and connect remotely to databases. Thanks to this, the database platform is irrelevant—we support all operating systems. However, the database version is important, check the Prerequisites/Limitations section below for more information. Each minute, Database insights including metrics and properties are fetched remotely. We use a JDBC driver to connect to databases.

How can I get this feature?
EAP is closed, early adopter release will be available with ActiveGate 173.
Prerequisites/Limitations
- At least one Environment ActiveGate, version 1.157 or above
- Network connection from ActiveGate to the Oracle server
- Oracle version 11g or 12c (no support for RAC)
- There is currently no integration between Oracle database insights and Oracle host metrics that are captured by OneAgent
- The set of initially available metrics will be enhanced during the Preview (Let us know which metrics you’d like to see included!)
- A database user with read access to
v$views is required. - Preview disclaimer
What’s next?
This is just one step in a long list of features that we’re working on. Based on your feedback, we’ll add more metrics. At the moment, we’re working on the Top slowest statements page. We’ll then focus on to the Top waits page, advance events, and, finally, execution plans.


Looking for answers?
Start a new discussion or ask for help in our Q&A forum.
Go to forum