The latest Dynatrace release includes a number of new dashboard enhancements that provide significant usability improvements—particularly within large environments.
Earlier this year we added the ability to collaborate using shared dashboards. This eases dashboard maintenance by allowing specific users to edit them. Once a dashboard is complete, it’s easy to share it with specific users. A common use case for this is the need to provide a set of dashboards for new team member onboarding. So we’ve also added the ability to quickly publish a dashboard across an entire environment.
A better-organized dashboard overview
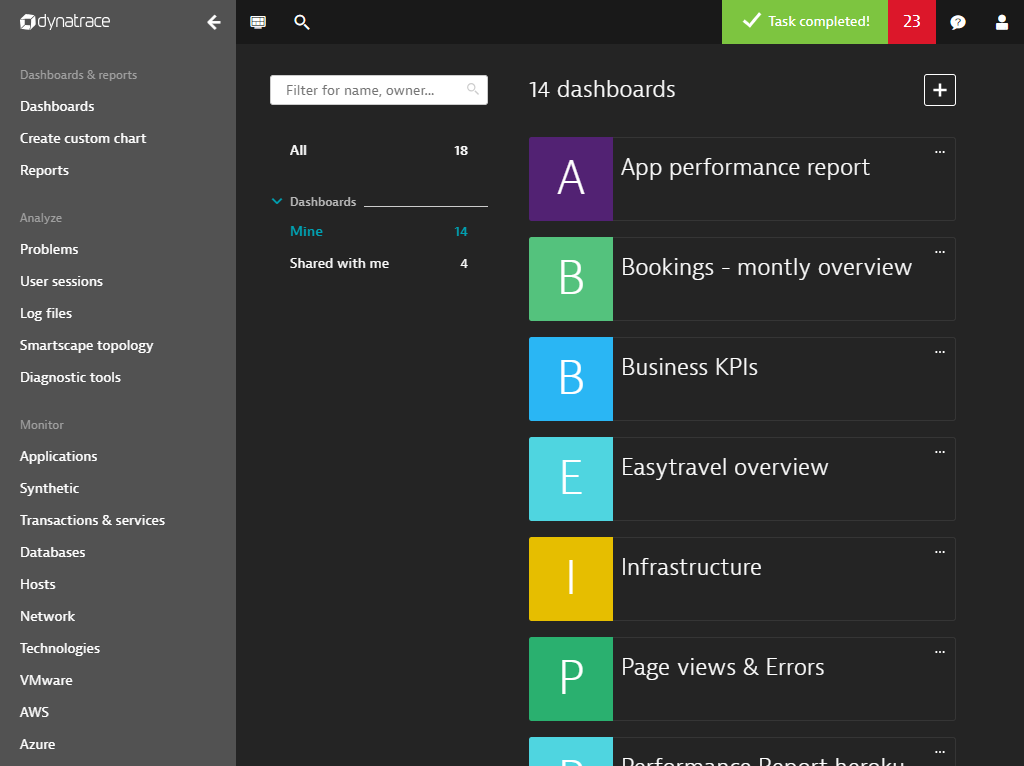
As more teams in your organization begin to work productively and collaborate using Dynatrace dashboards, the number of dashboards naturally increases, creating the need for a more structured dashboard overview. This is why with Dynatrace Server version 1.153 we’ve introduced filters on the dashboard overview page based on ownership.
The following dashboard filters are available:
- All: All dashboards that you’ve created plus those dashboards that are shared with all users environment-wide.
- Mine: All dashboards that you’ve created.
- Shared with me: All dashboards created by other users who have granted you read or edit permissions to their dashboards.
To view the new filters (see example below), select Dashboards from the navigation menu.

Dashboards in the context of management zones
Dynatrace management zones are used to partition monitoring data based on team ownership and responsibility. Ever since management zones functionality was released in beta, dashboard content is now automatically filtered whenever a management zone is selected.
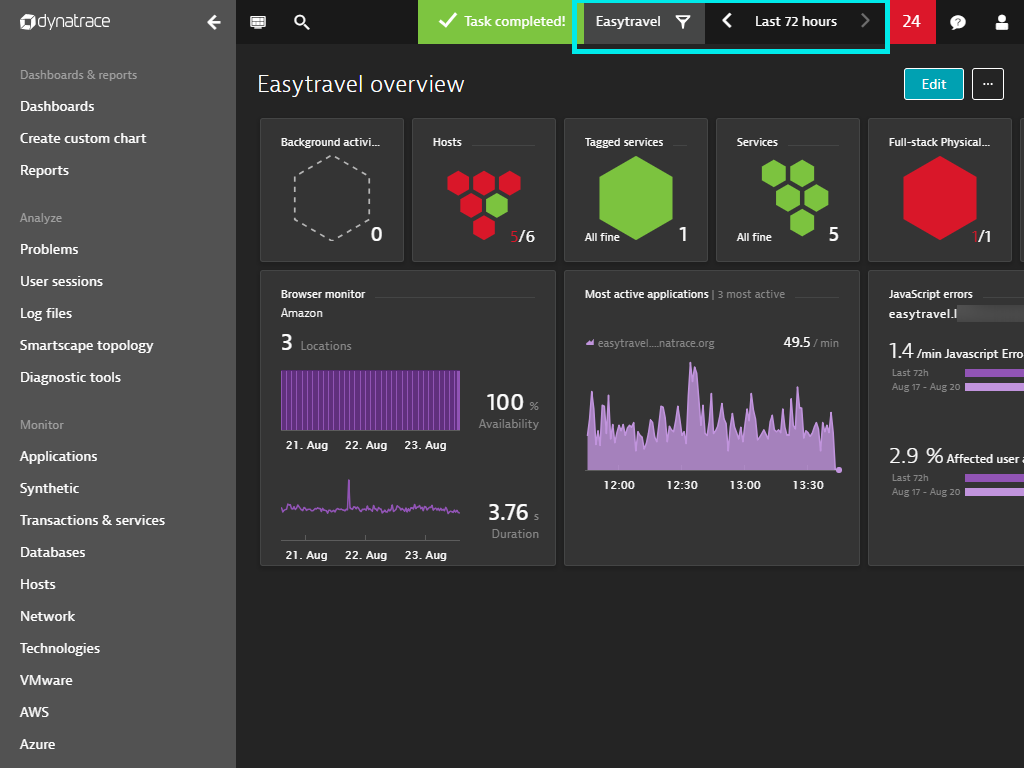
Now with version 1.153, saving a dashboard automatically persists the selected management zone and the selected time frame. This ensures that whenever the dashboard is viewed in the future, the intended management zone and time frame that the dashboard was built for will be shown.

To ensure security, team members who view a zone-specific dashboard without having the required management zone permissions are presented with a dashboard that has no content. The user must select a management zone they have permission to view before data is displayed on the dashboard.
What you get with this update
- Filtering of the dashboard overview page based on All, Mine, or Shared with me.
- Management zone and time frames are automatically persisted upon saving of dashboards.
- Dashboards now display the current management zone scope and time frame.
What’s next
Be sure to follow our post in the Dynatrace Community user forum, Planned enhancements for custom dashboards, to stay up-to-date on our progress. We want your feedback, so please share your thoughts and ideas with us there.


Looking for answers?
Start a new discussion or ask for help in our Q&A forum.
Go to forum