Even as we continuously work to improve Dynatrace capabilities for improving the search, segmentation, and analysis of user data within User session analysis view, there may still be use cases for monitoring the real-user experience of your customers that Dynatrace doesn’t support out-of-the-box.
All these use cases and more are now possible thanks to the updated Dynatrace REST API, in combination with our new User Session Query Language (USQL).
Maybe you’ve considered integrating additional user session data into your CRM tools or applications used by your support teams (for example, device type, last application access, or the number of sessions during a specific time frame). Or possibly you’re using reporting software and you want to include the number of user sessions based on country and application, or the average Visually complete and Time to first byte metrics for your user actions, grouped by screen size.
The Dynatrace RESTful API now enables you to access all user session and user action data that is currently available in User session detail view for each user session (note that code-level data such as waterfall analysis and JavaScript errors aren’t included).
User Session Query Language (beta)
As your applications may support millions of user sessions, it makes sense to use advanced segmentation/search functionality to fine-tune the results you’re interested in. To provide you with maximum flexibility, we’ve introduced the User Session Query Language. By using USQL statements as input parameters for the Dynatrace REST API, you now have complete control over what data is returned and how that data is returned.
Note: The API and the query language are currently in public beta status.
API call example
To make an API call with USQL and the REST API
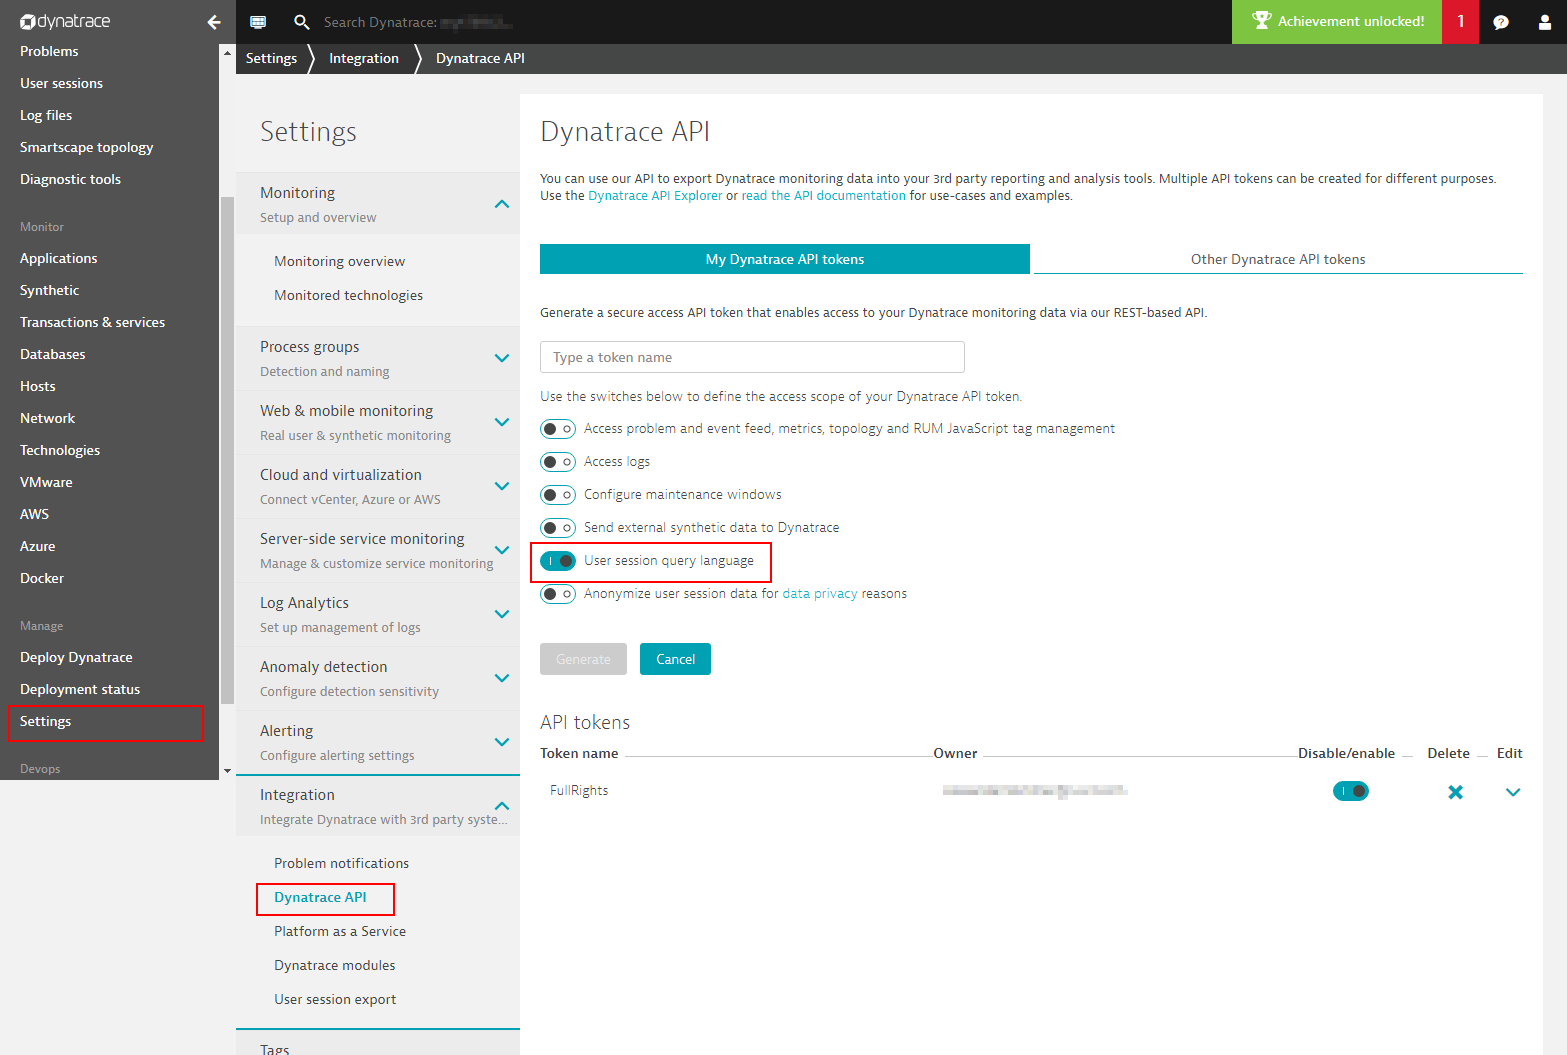
- Select Settings > Integration > Dynatrace API from the navigation menu.
- Generate a valid access token that includes User session query language access in its scope.

- Copy the access token to your clipboard.
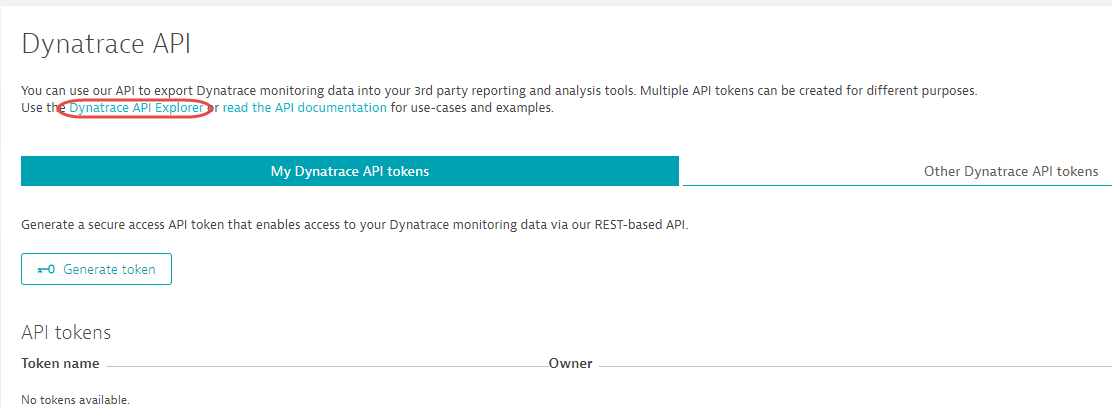
- From the navigation menu, select Settings > Integrations > Dynatrace API.
- Click the Dynatrace API explorer link at the top of the page to open the Dynatrace API explorer.

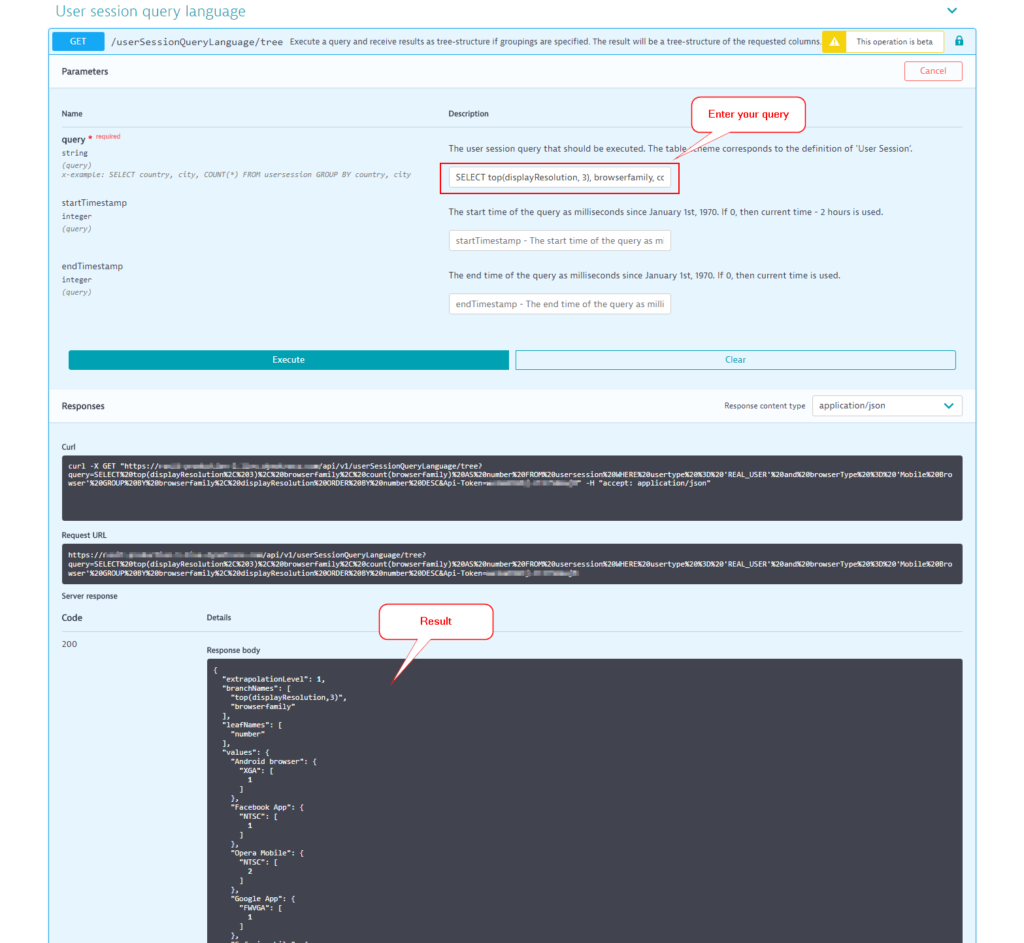
- Within the API Explorer, open the User Session Query Language section and click the Try it button to familiarize yourself with the API and USQL.
- For this example, let’s query the top 3 mobile-device display resolutions used by real users. The results should be organized by browser family and ordered, as shown in the following query:
SELECT top(displayResolution, 3), browserfamily, count(browserfamily) AS number FROM usersession WHERE usertype = 'REAL_USER' and browserType = 'Mobile Browser' GROUP BY browserfamily, displayResolution ORDER BY number DESC - Paste the query into the input field and click Execute (Note that traffic from real users and mobile browsers is required for this example).

- USQL offers you two tables:
User sessionsandUser actions. You can find all the details in Dynatrace Help and by looking at the models in API explorer view. Here two more examples:
Example 1: Give me the average user action duration, visually complete, and DOM complete time for all frustrated load user actions that are not part of a bounced session. Note thatusersessionis used to access user session attributes when selecting data from user actions.
SELECT avg(duration), avg(visuallyCompleteTime), avg(domCompleteTime) FROM useraction WHERE usersession.bounce is false AND apdexCategory = 'FRUSTRATED' AND type = 'Load'
Example 2: I want to know the number of named users of mobile applications who have accessed a user action with the name “Touch on Search”.SELECT count(userid) FROM usersession WHERE applicationType = 'MOBILE_APPLICATION' and useraction.name = 'Touch on Search'
Please keep in mind that this REST API has the same rate limit as the other APIs. If you need all user sessions to be fed into your data warehouse, Dynatrace offers the user session export stream.
What’s next?
Over the coming weeks we’ll add new features to the USQL and, of course, we’re also working on an integration so that you can use the query language within the UI and even pin your queries to your Dynatrace dashboards.


Looking for answers?
Start a new discussion or ask for help in our Q&A forum.
Go to forum