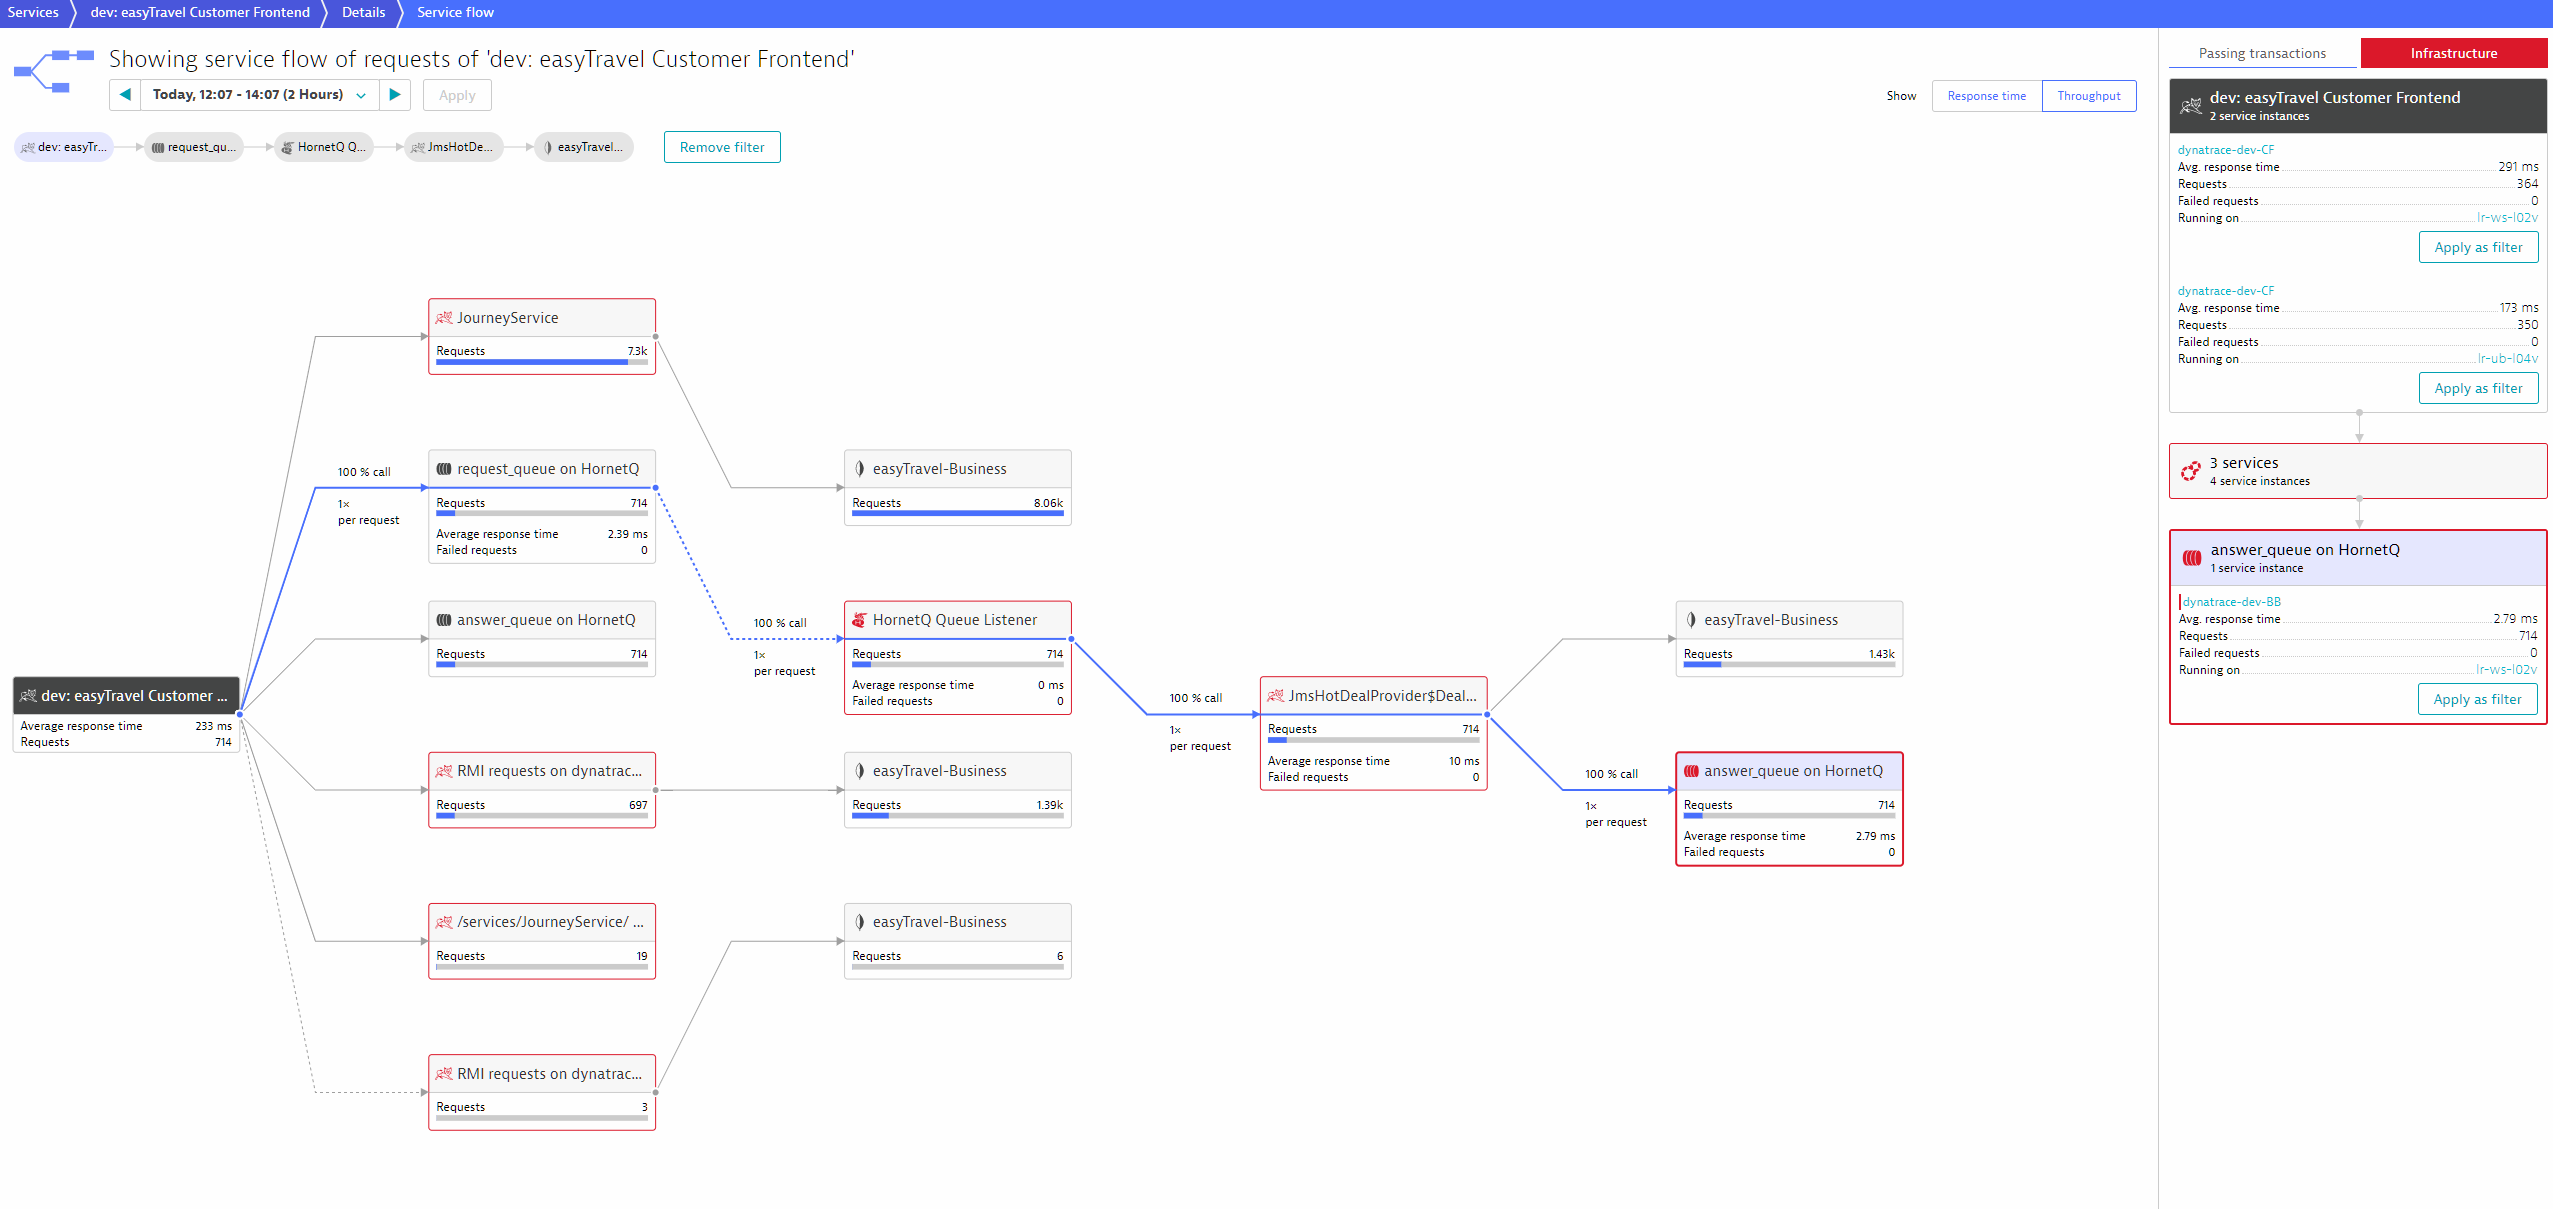
We recently announced that Service flow now shows infrastructure and load balancer details. Building upon this major enhancement to Dynatrace service monitoring, we’ve now added health information and a throughput-analysis mode to Service flow view.
As you can see in the example below, Service flow now shows health indicators when a service or its underlying infrastructure encounter a problem (note the tiles outlined in red). By clicking on the answer_queue on HornetQ tile, we can see more detail about this queue, including the fact that this queue is hosted by the dynatrace-dev-BB process group, which appears to be experiencing an infrastructure problem.
Throughput analysis
Note that there are two new buttons in the upper right corner of Service flow view, Throughput and Response time. These buttons enable you to toggle the focus of Service flow view from response time to throughput analysis. This makes it easy to understand where the majority of your application’s load and traffic go.
New Service flow filters
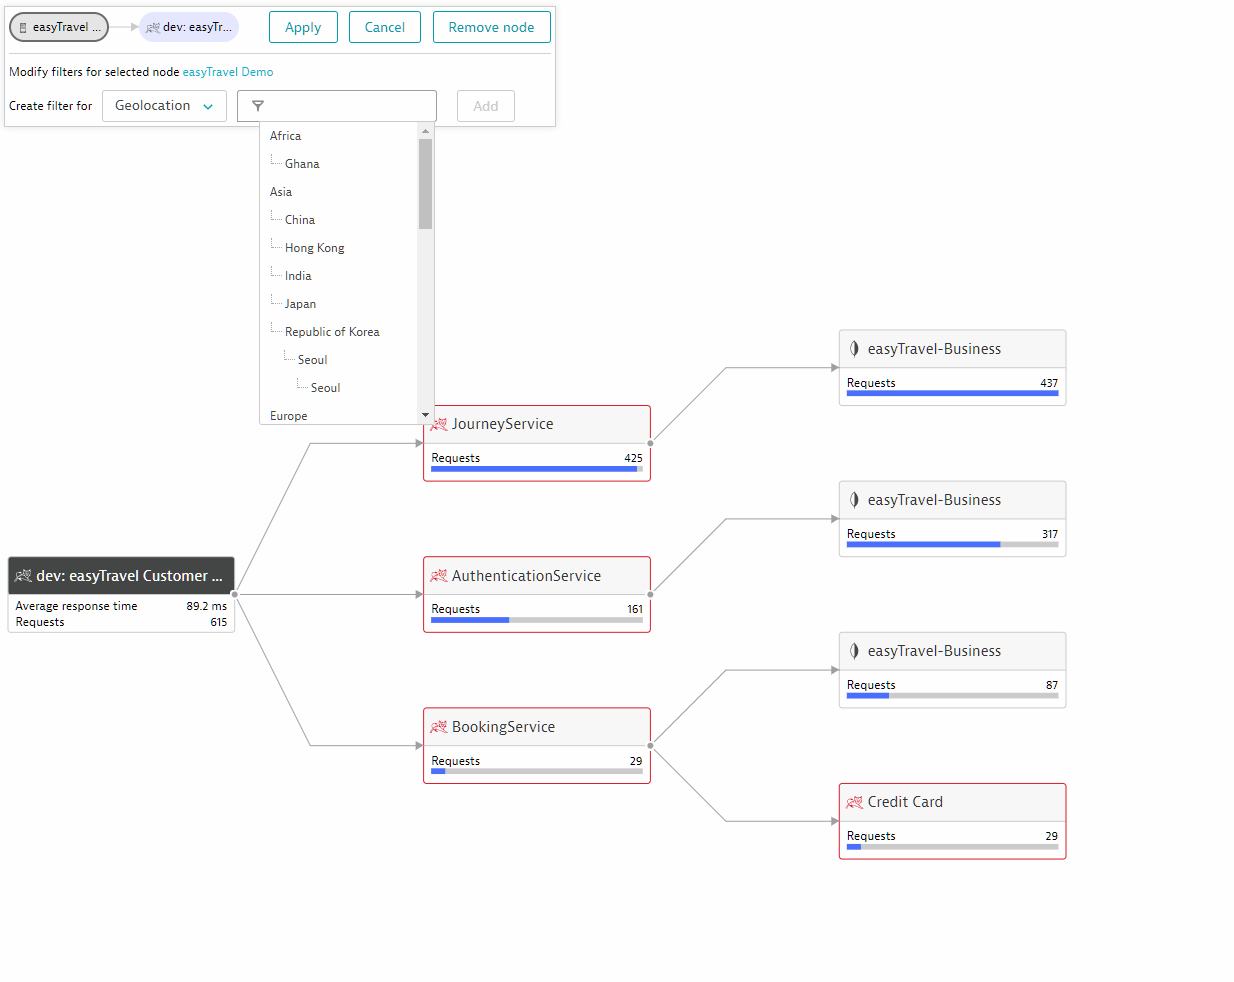
We’ve also enhanced Service flow (and all other analysis pages actually) with a new set of powerful filters. You can now easily filter real user requests based on their geographic origin, the operating system of their browser, and much more.
You can now also easily filter by proxies anywhere in the filter chain. This enables you to use these powerful filters anywhere.
We hope you find this latest round of Service flow improvements to be valuable. As always, your feedback is greatly appreciated!


Looking for answers?
Start a new discussion or ask for help in our Q&A forum.
Go to forum