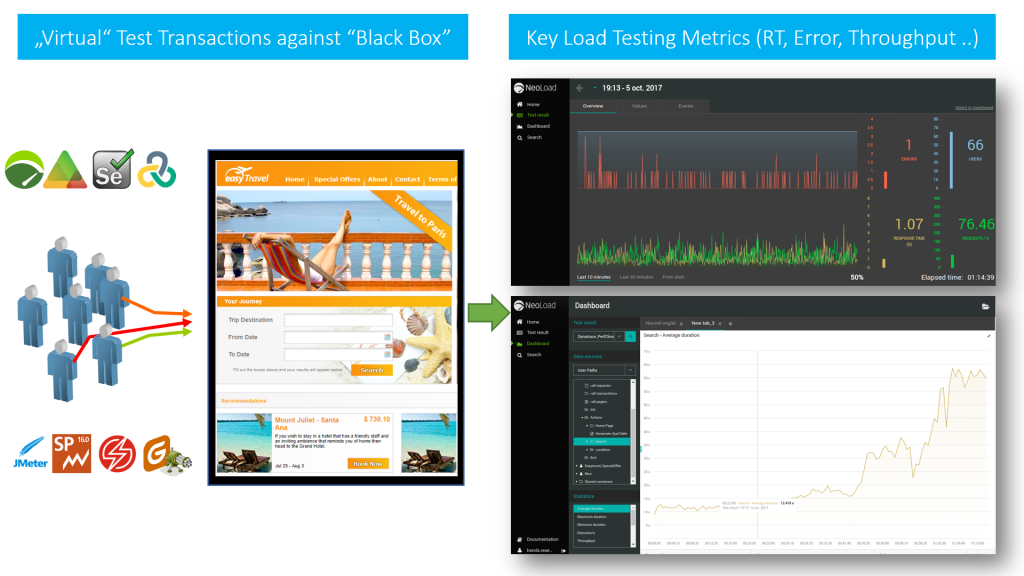
The primary goal of Performance and Load Testing hasn’t changed a lot since I started working in this industry in 2001. What has changed are the application frameworks (from plain HTML via jQuery to Angular) and a shift from page-based to single page apps consuming backend REST APIs using JSON via HTTP(S). Having these services accessible via well-defined service contracts is a blessing for load testers, as we can easily test the service endpoints in combination with “traditional” end-to-end virtual user transactions. From a load testers perspective though, we are still “just” running load against a “black box” and we still look at the same key performance metrics – either in reports, fancy web dashboards or even pulled into your favorite CI/CD server: Response Time, Throughput, Failure Rate (HTTP Status or within JSON Payload), Bandwidth (Transferred Bytes).

Redefine Load Testing: Stop Reporting. Starting Influencing.
If generating load and looking at these metrics is what you do, then I assume you are working in a “classical” load testing shop, performance center of excellence or a performance consulting organization. While it is not a bad thing to be in a comfortable situation like this, I would like to elevate your thinking about what I think performance engineering should look like in a world where our apps and services potentially run across hybrid clouds, in containers, in scalable micro-service architectures, in a PaaS (Platform as a Service) or on a serverless platform. Just simulating load and telling engineers and architects that something is slow or breaking under load is no longer the “value-add” of a performance engineering team. It’s about impacting architectural and deployment decisions based on your performance and load testing expertise.
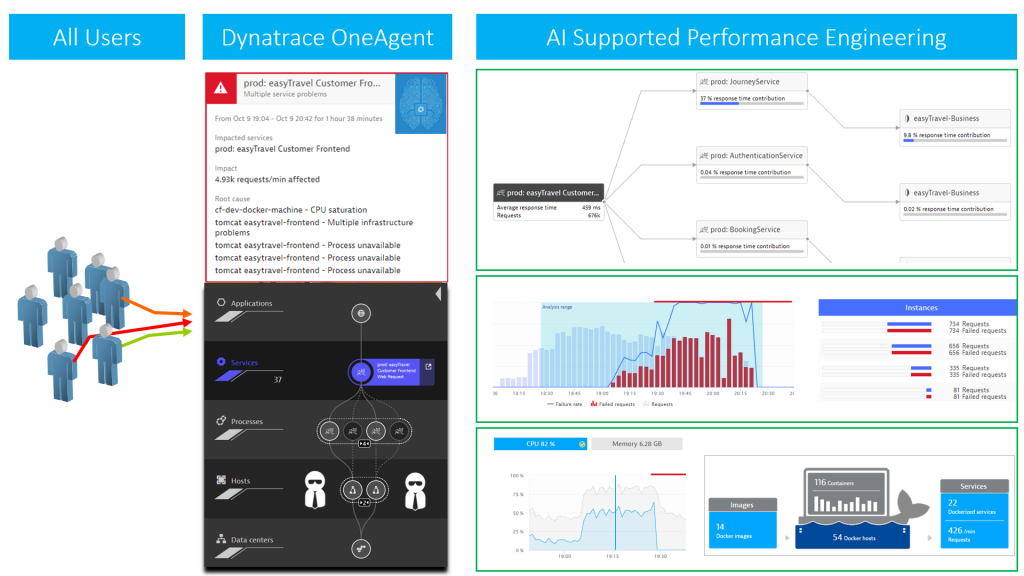
In my recent Performance Clinic (watch it on YouTube), I shared my thoughts on leveraging Dynatrace in combination with Load Testing Tools to go beyond analyzing key performance metrics, therefore getting insights into Service Flow, Cluster Load Distribution, Response and Error Hotspots, Log Analytics, Container and Cloud Utilization:

Ready for some change in your load testing approach? Then keep reading …
3 Steps to use Dynatrace in Load Testing
Before getting started I encourage you to watch my Performance Clinic where I discuss the following Integration Options of Dynatrace into Performance Engineering:
- Load Testing Metrics to Dynatrace
- “Tagged” Web Requests
- Dynatrace Metrics to External Tool
- Continuous Performance
If you want to try it in your own environment follow these three simple steps
- Get your own Dynatrace SaaS Trial or request a Managed (=On Premises) Trial
- (optional but recommended) “Tag” your web requests as explained in my tutorial
- Execute your tests and start diagnosing your data
#1 – Get your Dynatrace Trial
That’s very straight forward. We give you the option to either sign up for a Dynatrace SaaS Trial or request a Dynatrace Managed (=On Premises). Once you have access to your Dynatrace Tenant simply deploy your Dynatrace OneAgent on those hosts that host your application and services you are testing against. If you want to learn more about Dynatrace itself, make sure to also check out our free tutorials on Dynatrace University as well as our Dynatrace YouTube channel.
#2 – “Tagging” Web Requests
Let me briefly explain “Tagging Web Requests.” This is a technique to pass Test Transaction Information to Dynatrace for easier and more targeted analytics. It is a concept our Dynatrace AppMon Users have been using very successfully in the past which we can also do in our Dynatrace platform (both SaaS and Managed).
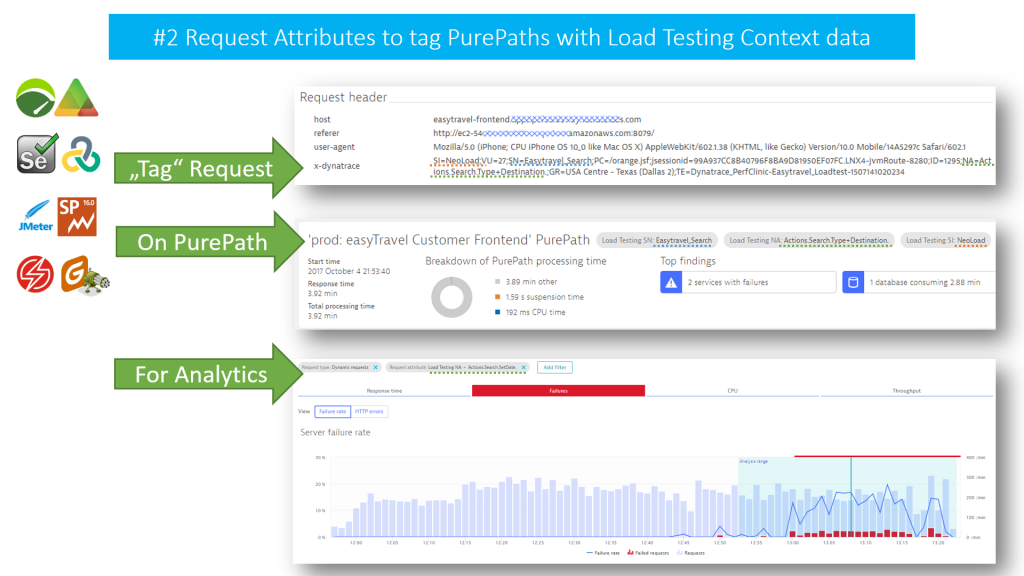
Most testing tools have a concept of test script, transaction and virtual user. While executing a test, each simulated HTTP Request can be “tagged” with an additional HTTP Header that contains. (e.g: Script Name, Transaction Name, Virtual User Id, Geo Location, …)
Dynatrace can analyze incoming HTTP Headers and extract information from the header value and “Tag” the captured PurePath with that contextual information. Having a tag on a PurePath allows us to analyze PurePaths with specific tags. (e.g: Analyze those PurePaths that came in from Script “Scenario1” and Transaction “Put Item into Cart”.)
The following is taken from my Performance Clinic and shows how testing tools can add the x-dynatrace HTTP Header and add several pieces of context information to that header value:

In the example above, I choose the header x-dynatrace and the same key/value format Dynatrace AppMon analyzes when integrating with load testing tools. This is to show that our AppMon users can repurpose any converted Load Runner, JMeter, SilkPerformer, Neoload, Apica, … script. The good news with Dynatrace is that you are not bound to this format. You can use any (or several) HTTP Header or HTTP Parameter to pass context information. You configure the extraction rules via Settings -> Server-side service monitoring -> Request attributes.

If you want to learn more about Request Attributes simply open the configuration section in your own Dynatrace Tenant or check out this blog post about Request Attribute Tagging.
#3 Execute Tests and Analyze Data
If your app is monitored with Dynatrace OneAgent, it is time to simply run your load test. Dynatrace will not only automatically capture every single request you simulate end-to-end down to code level, but it will also see everything else that goes on in your environment. (e.g: all other processes and their resource consumption on every monitored host, network traffic between all services and applications, every critical log message, configuration changes and much more…)
There are different ways to analyze the data and the approach really depends on what type of performance analysis you want to do, e.g: crashes, resource and performance hotspots or scalability issues. In my Performance Clinic I walked through my Top 5 Diagnostic Approaches which I want to highlight here as well:
My Top 5 Diagnostic Approaches
Whether you have configured Request Tagging or not – after you have installed Dynatrace OneAgent and executed your load test, you can go ahead and start analyzing the performance of the tested system. Once you get familiar with Dynatrace and see the breath of capabilities you will soon discover more options but these five are a great start:
#1 AI (Artificial Intelligence) Detected Problems
The Dynatrace AI works extremely well in high load environments where, over time, the AI has the chance to learn how your system behaves, understands dependencies and builds up baselines. If you only run sporadic load tests for short periods, the AI might not detect as many problems for you as in a high load production environment due to lack of good baselines. In any case the AI will spot critical problems and immediately show you the root cause.
If you watch my Performance Clinic, you will see that in our 2-hour load test we ran into a gradual decline of performance of one of the microservices our application is using. This was enough for the AI to detect that there was a performance issue and immediately pointed us to the root cause. From the Problem Ticket, we could drill down further down to code level:

To better support the AI in Load Testing environments with sporadic test executions, I suggest leveraging Dynatrace Maintenance Windows for the times where your system is not under load. I covered this in the “Tips & Tricks” section of my Performance Clinic. Using Maintenance Windows will tell the AI to simply ignore (and stop learning) in the times where you obviously don’t run load.
#2 Transaction Specific Hotspot Analysis
My natural approach to optimize performance is to pick those transactions that consume most of the resources (CPU), are the slowest (Response Time) or have a high failure rate. In Dynatrace, I open the Service Details view of the Service I tested against. After selecting the correct time frame, I scroll down to the Top Request section. If you have “Request Tagging” configured you will see your hotspot tests in the “Request attributes” tab. Otherwise you simply focus on Top Requests based on URL.

Make sure to click on that test name or URL. As Dynatrace captured every single request end-to-end, it will show you the historical data for that selected transaction over the course of your recent test, previous tests and beyond. Click into the chart to select the time frame where you had the slowest response times, highest CPU consumption or highest failure rate. Then select one of the diagnostics option to get directly to the Response Time Hotspot, Failure Analysis or straight to PurePath.
#3 Architecture Validation
As testers, we typically only test against the service endpoint. As performance engineers we should however understand what happens end-to-end with that request. Which other services does it call? How many round trips to the database does it make? Does service load balancing and failover work correctly? Do the caching layers work well? And do we have any bad architectural patterns such as a data-driven N+1 query problem?
In Dynatrace, we analyze the Service Flow which shows us the full end-to-end flow of every request executed against our service endpoint. I can also apply filters to only focus on a particular test transaction, a specific time frame or compare the flow of failing vs non- failing transactions:

Just as with hotspot analysis, I eventually end up in the PurePath as I want to understand which service and code line is responsible for “bad architectural behavior”!
#4 Log Analytics
The Dynatrace OneAgent not only gives you insights into your services and end-to-end requests, it also sees every single log message that is written by ANY process on your hosts. This comes in handy if you want to analyze what useful information developers put into logs or what happened in components that might be running next to your application on the same host.
To make it easier, Dynatrace automatically detects critical log messages written by any process in your system and highlights those. But it also gives you easy access to all log content and then perform log analytics on top of all log data.

Gone are the times where you must collect remote log files from different locations. You no longer need to remote into machines and copy all of the files to a central location for analysis. All of this is handled by the Dynatrace OneAgent.
#5 Infrastructure
Did I mention that OneAgent provides A LOT of insight out of the box? 😊
Very often application performance is impacted by problems in the infrastructure, (e.g: over-committed virtual machines), leading to resource shortage, a bad network connection resulting in dropped packages or simply, a powered down machine hosting a mandatory service that nobody thought of starting up during the test.
Dynatrace OneAgent captures this infrastructure focused data, feeds it into the AI and makes it available for your performance engineering work. And for systems where we can’t install OneAgent, Dynatrace either provides out-of-the-box integrations, )e.g: AWS CloudWatch, OpenStack, VMWare, …) or gives you the chance to feed data into Dynatrace using the Dynatrace REST API:

Also, check out our OneAgent Plugins that can capture more infrastructure and component metrics and learn how to write your own plugins. Coming soon: Remote Agent Plugins! Stay tuned for that!
Redefining Performance Engineering: It’s a team sport
I have seen that performance engineering has transformed into a DevOps Team Sport. With the rise of Continuous Deployment, it is no longer sufficient to hand performance testing reports back to engineers at the end of a development cycle. “Redefined Performance Engineers” see Performance Engineering as a Team Sport where performance data is produced and shared continuously with the goal of improving the team output: which is the software your users want to enjoy!


Looking for answers?
Start a new discussion or ask for help in our Q&A forum.
Go to forum