Dynatrace has provided topological queue support for over two years now. This has enabled Dynatrace to show you which requests in your environment communicate with which queues. It also enables topographical modeling of your queue-based service communications. Many metrics for queueing systems like ActiveMQ and RabbitMQ are also available.
We’re now releasing major enhancements to our queuing support. We’re proud to announce the availability of end-to-end tracing of individual requests across message queues.
Queue interactions of your services
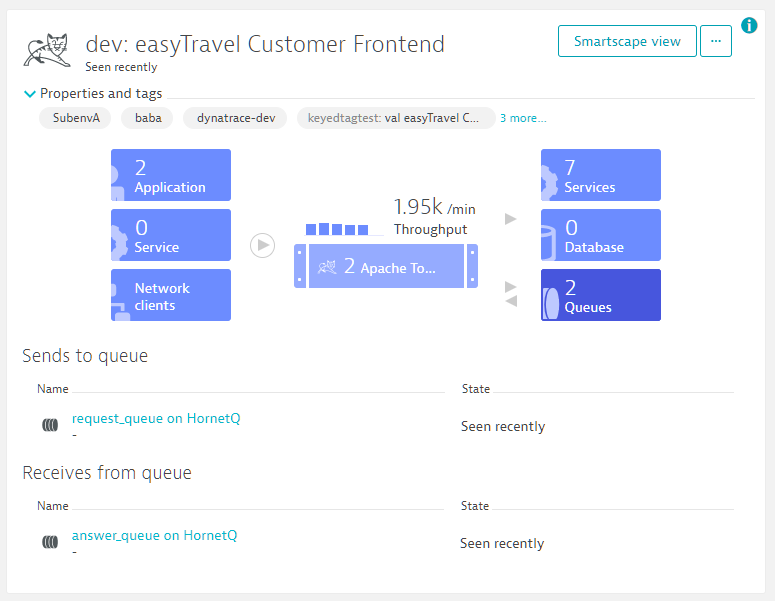
No changes have been made to overview pages of services that use queues (see example below).
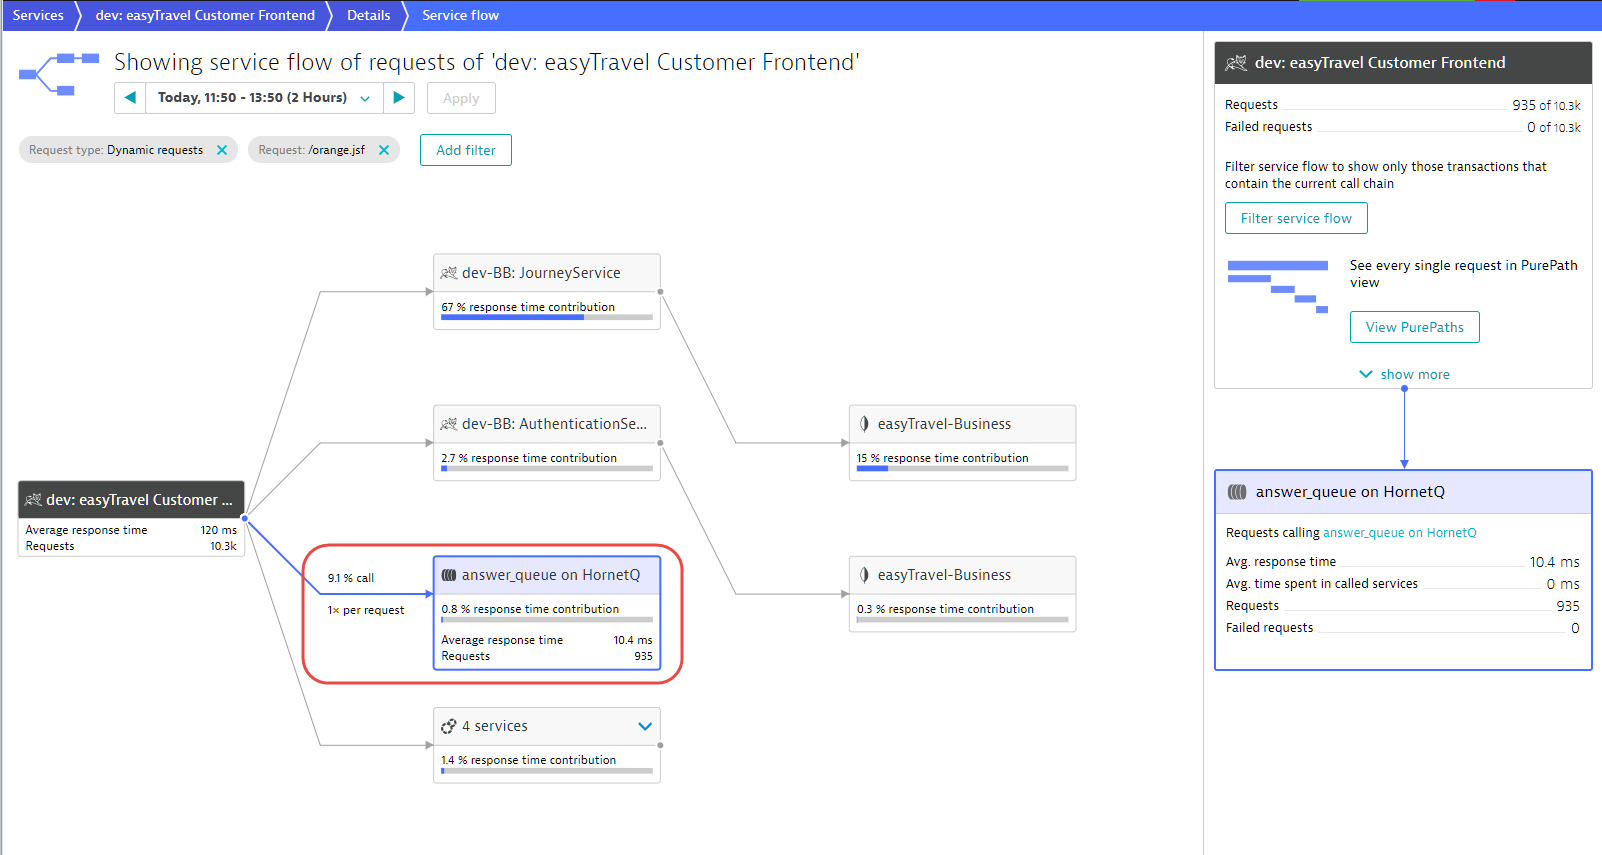
What is new is that queues are now represented in Service flow visualizations. Clicking the answer_queue on HornetQ queue node in the Service flow example below reveals that 9.1% of this service’s requests communicate with the answer queue. By clicking the Filter service flow button we can analyze this subset of requests that communicates with the answer queue.
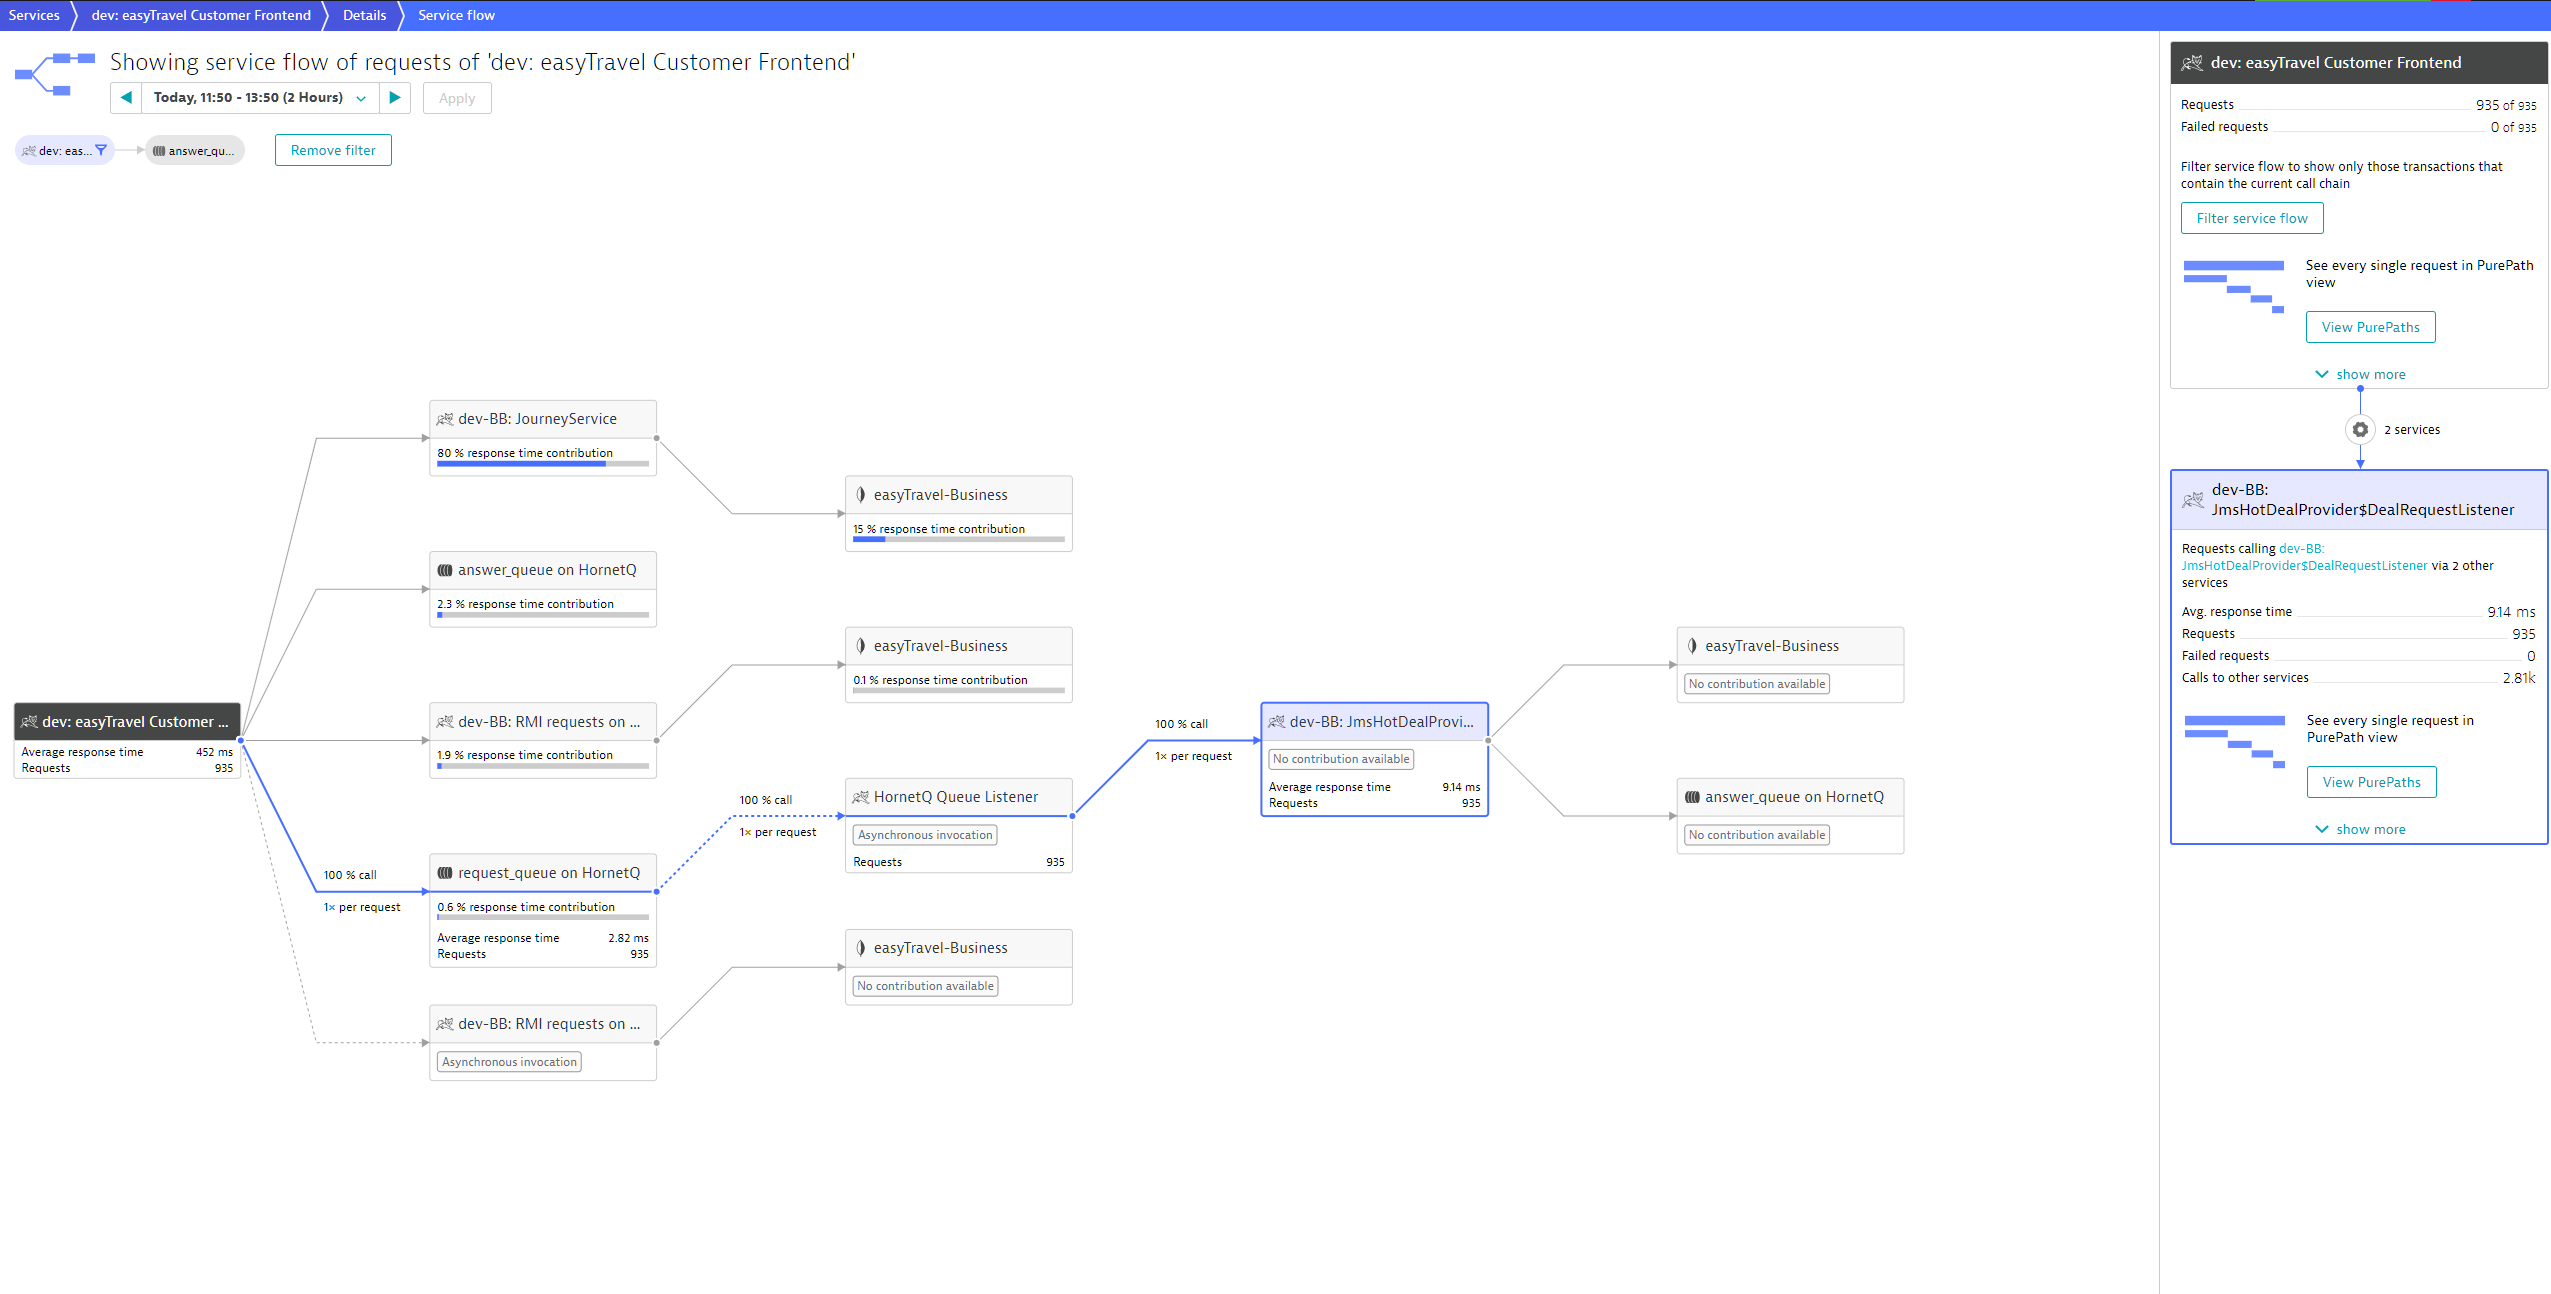
The resulting service flow now shows only those requests that use the answer queue. This reveals that all requests that use the answer queue actually send messages to the request_queue as well. Not only can we now see what happens to these messages, we can also see that these messages are processed by a JMS service called JmsHotDealProvider. We can also see that this service uses answer_queue to send its replies.
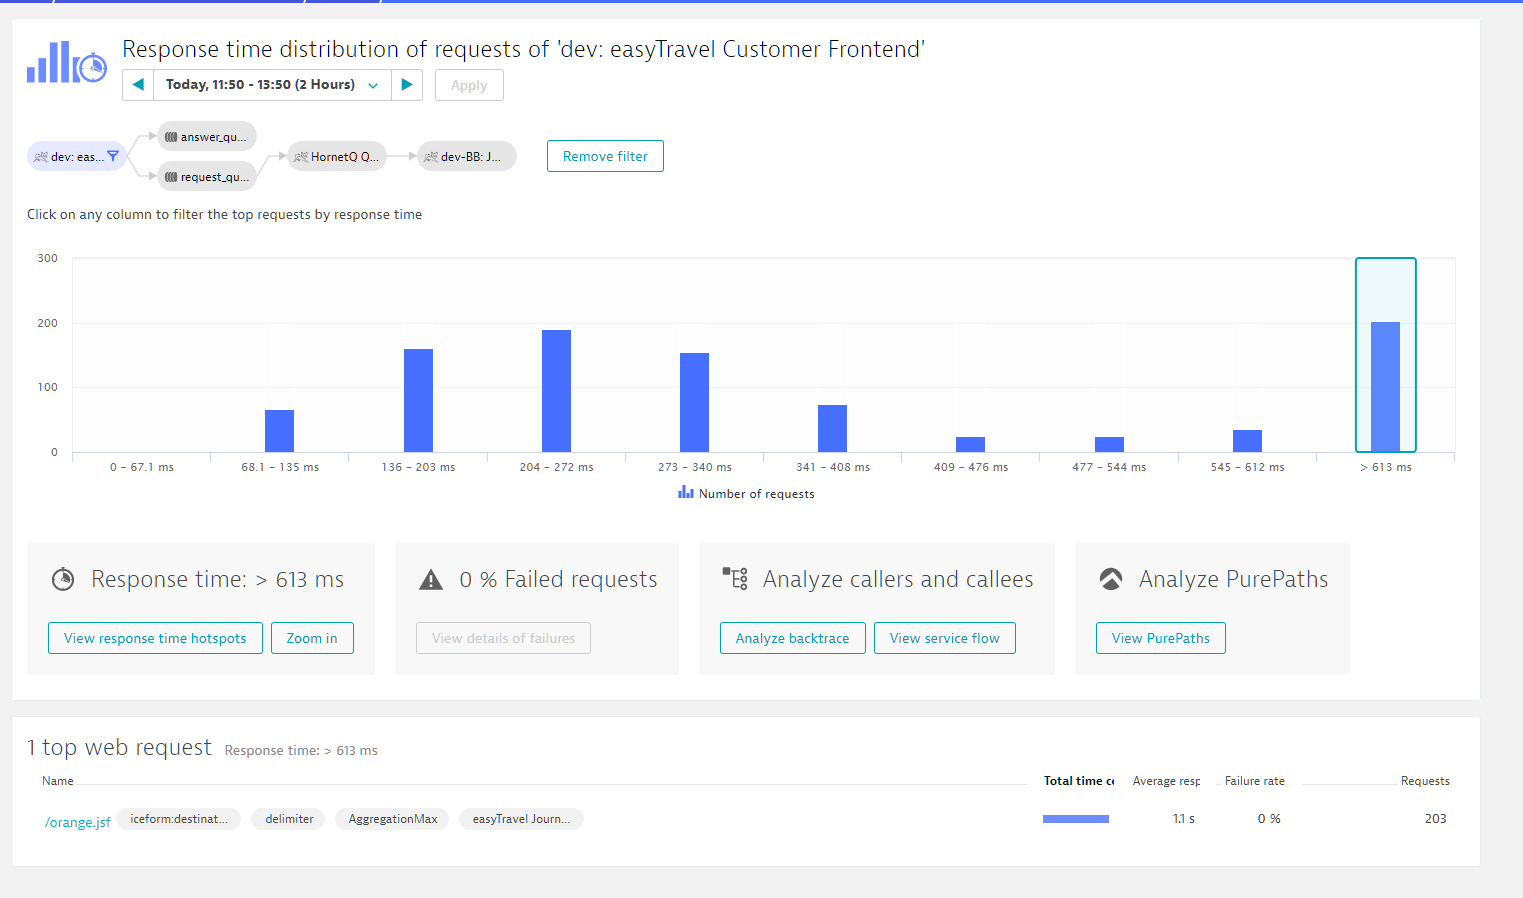
With the newly added functionality, Dynatrace can now detect that the HotDealProvider service is the root cause of the problems related to requests to the easyTravel Customer Frontend! Dynatrace can now also analyze the impact that this asynchronous processing has on the response time of the easyTravel Customer Frontend service. This is done using Response time distribution of requests analysis for the selected call chain (see example below).
The filter tells us that we’re looking at requests that send messages to the request queue and are subsequently processed by the JMSHotDealProvider service.
As you can see, the response times vary a lot. By drilling into the slower response times we can identify the slowest response time of all.
From here we can look at a single request and understand what happens to a single message. Here we can see when the message was sent during request processing, when it was picked up, and how long its processing took. We also see that the easyTravel Frontend service waited the entire time for a response from the answer_queue.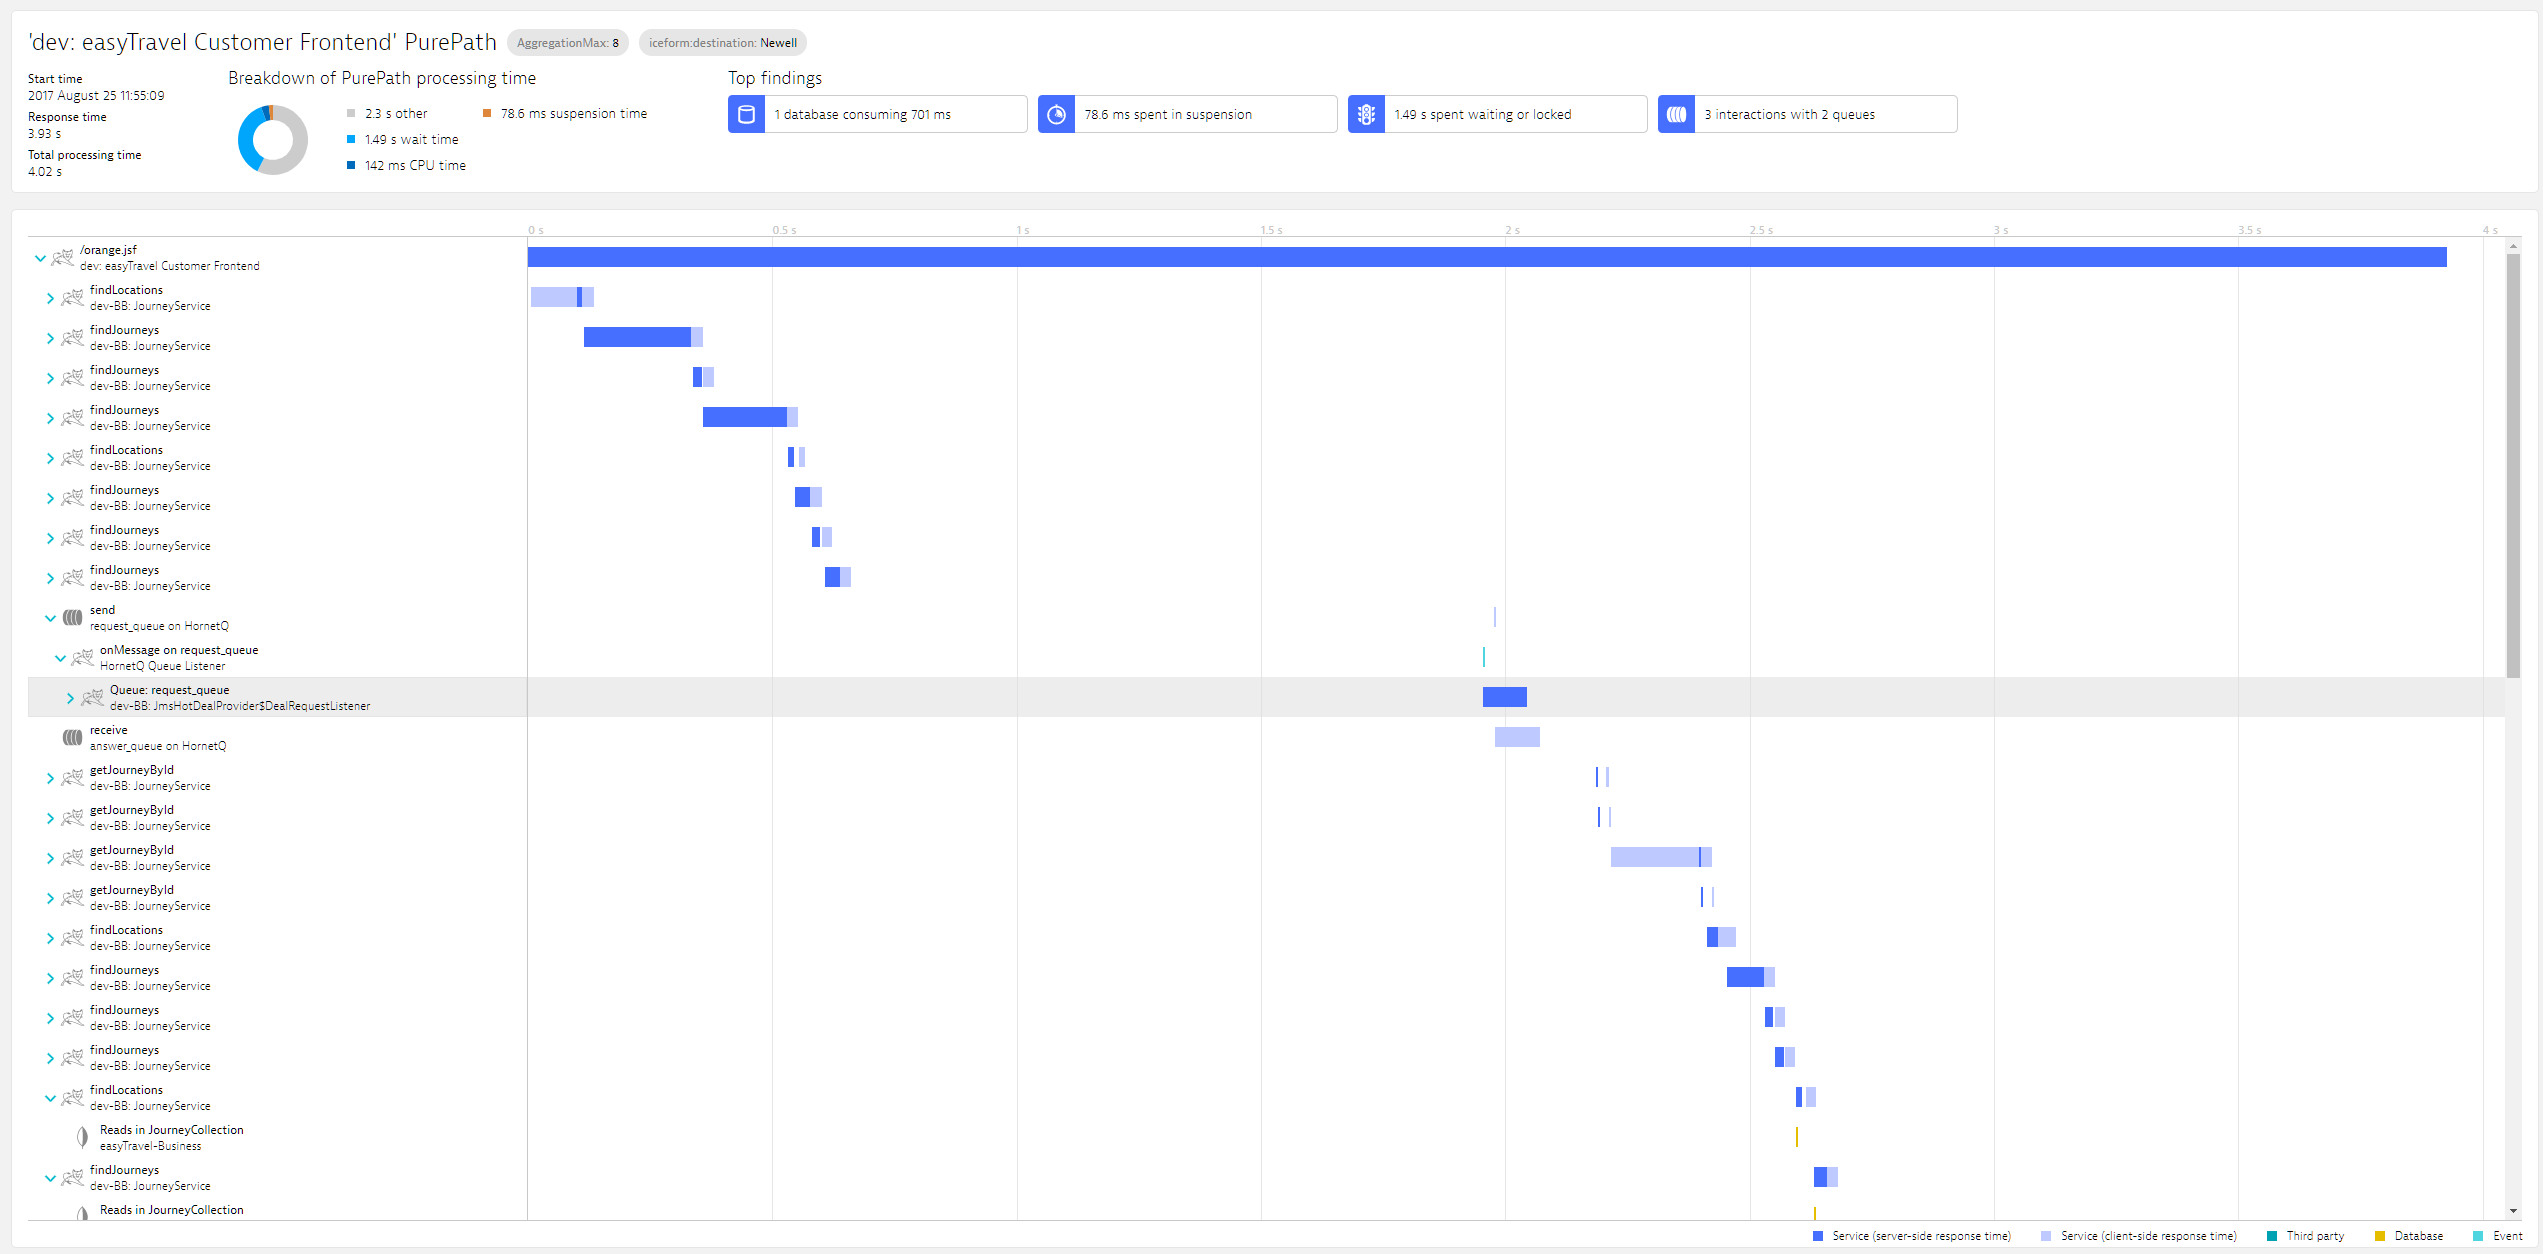
Where messages originate
Understanding where your messages go is one thing, but often you also need to know where the messages to your service are sent from. This is where Service backtrace comes in handy. In the example below, you can see that the majority of messages processed by the JMSHotDealProvider service originate with the CalculateRecommendations user action. A few of them however are triggered by a click on the New Search button.
Which queuing systems are supported
Dynatrace currently supports all JMS-compatible queueing systems and RabbitMQ for Java processes. We’ll extend this to other technologies in the near future.
Note: This feature requires Dynatrace OneAgent 1.129 or higher



Looking for answers?
Start a new discussion or ask for help in our Q&A forum.
Go to forum