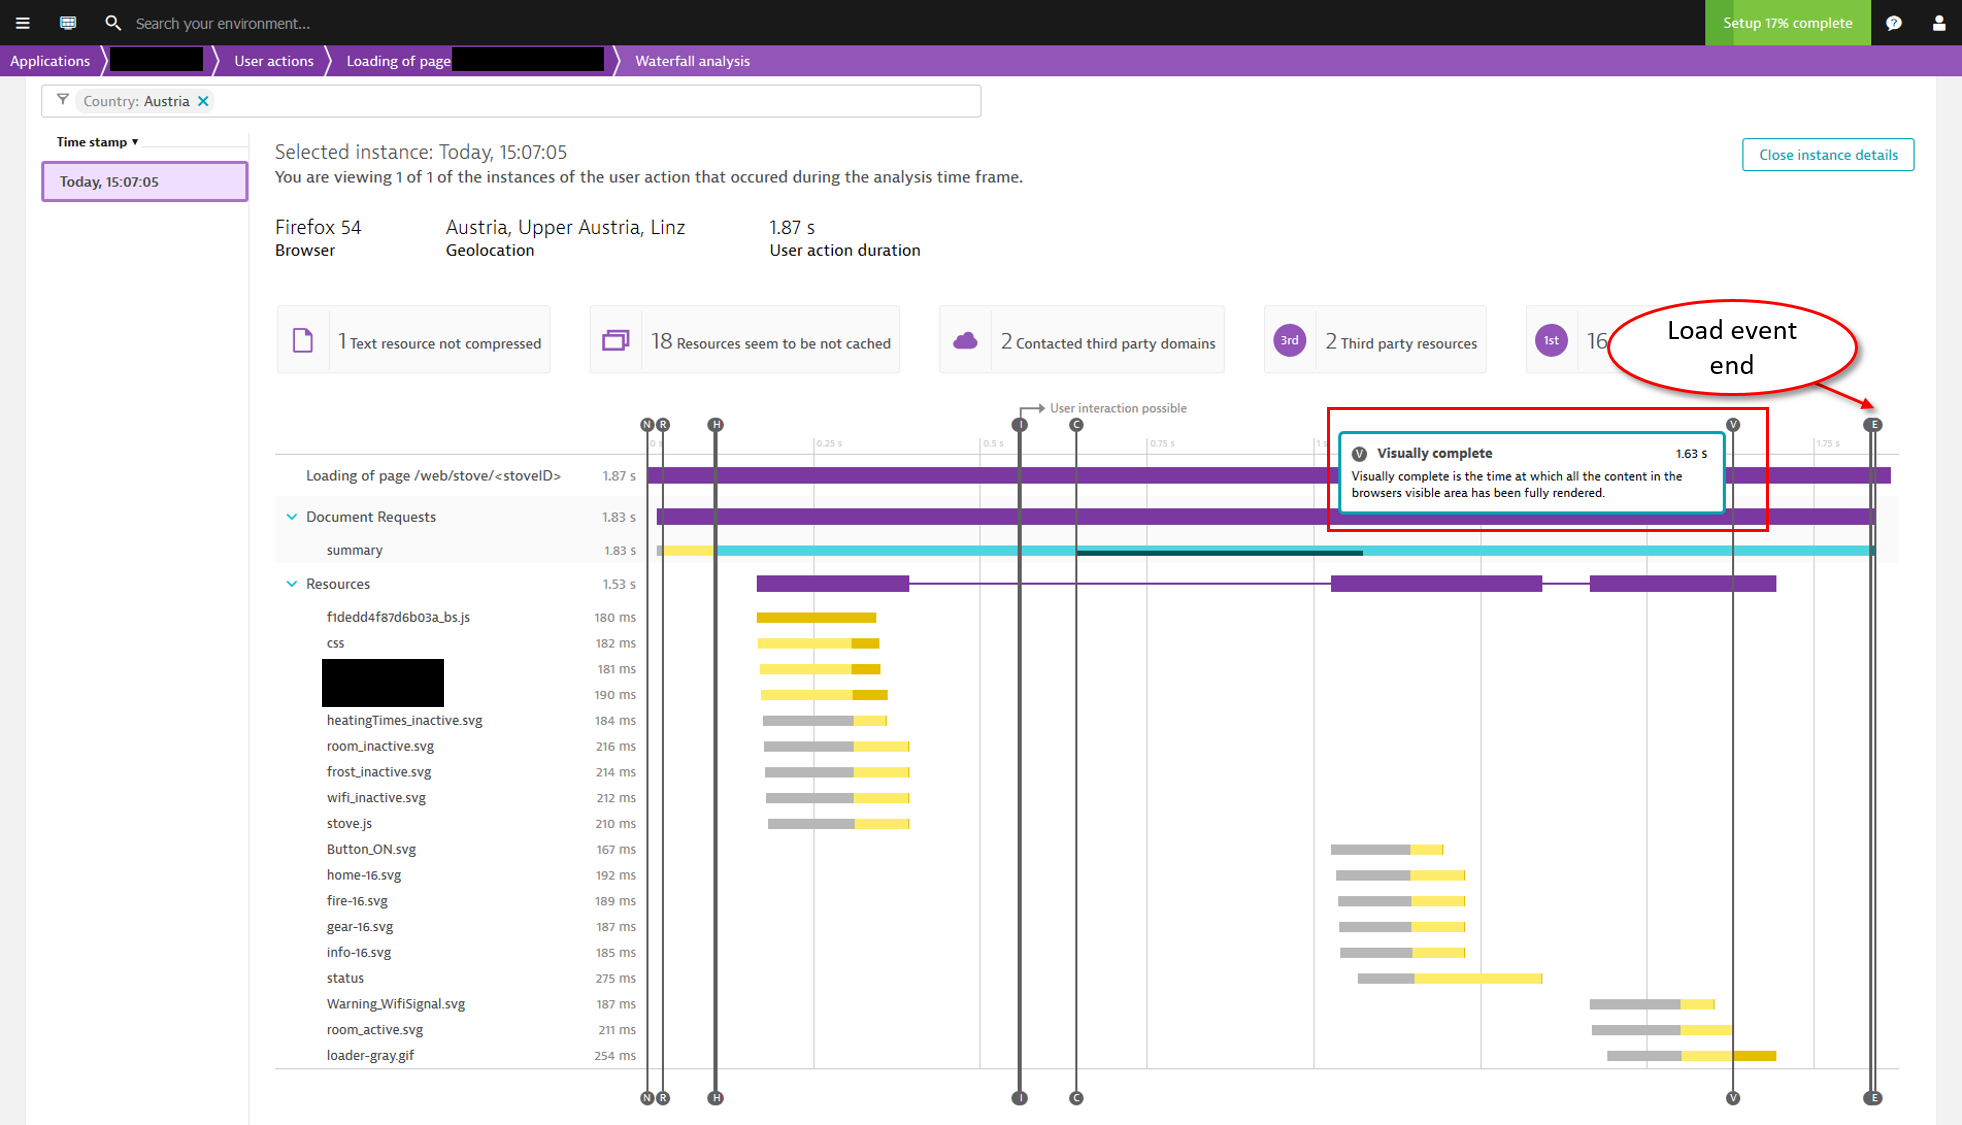
Traditional web performance metrics focus primarily on load times and resource sizes. These attributes typically aren’t, however, the best indicators of user experience. Resources that don’t have an impact on user experience can result in delays of the loadEventEndevent and other W3C navigation timing metrics that skew your analysis. Conversely, you may experience the opposite effect, particularly when monitoring single-page applications. With such apps, W3C navigation timings may be triggered too early—even before JavaScript code has begun building up the actual user interface.
Visually complete: The ideal user experience metric
So what is the best metric to consider in measuring your customers’ actual experience with your applications? As it turns out, users are primarily focused on how long it takes for visual page elements above the fold to render completely. This is why Dynatrace has introduced the Visually complete metric into user action waterfall analysis.
Visually complete is a user experience metric that identifies the moment in time when users perceive that all the visual elements of a page have completely loaded. Because this is a measure of user perception, it is an ideal measure of user experience. Visually complete metrics are typically shorter in duration than comparable metrics, for example, page load time, because users perceive complete page load before 100% of background page elements have loaded. As you can see in the example below. The Visually complete milestone is reached before the page has loaded completely.
Speed index
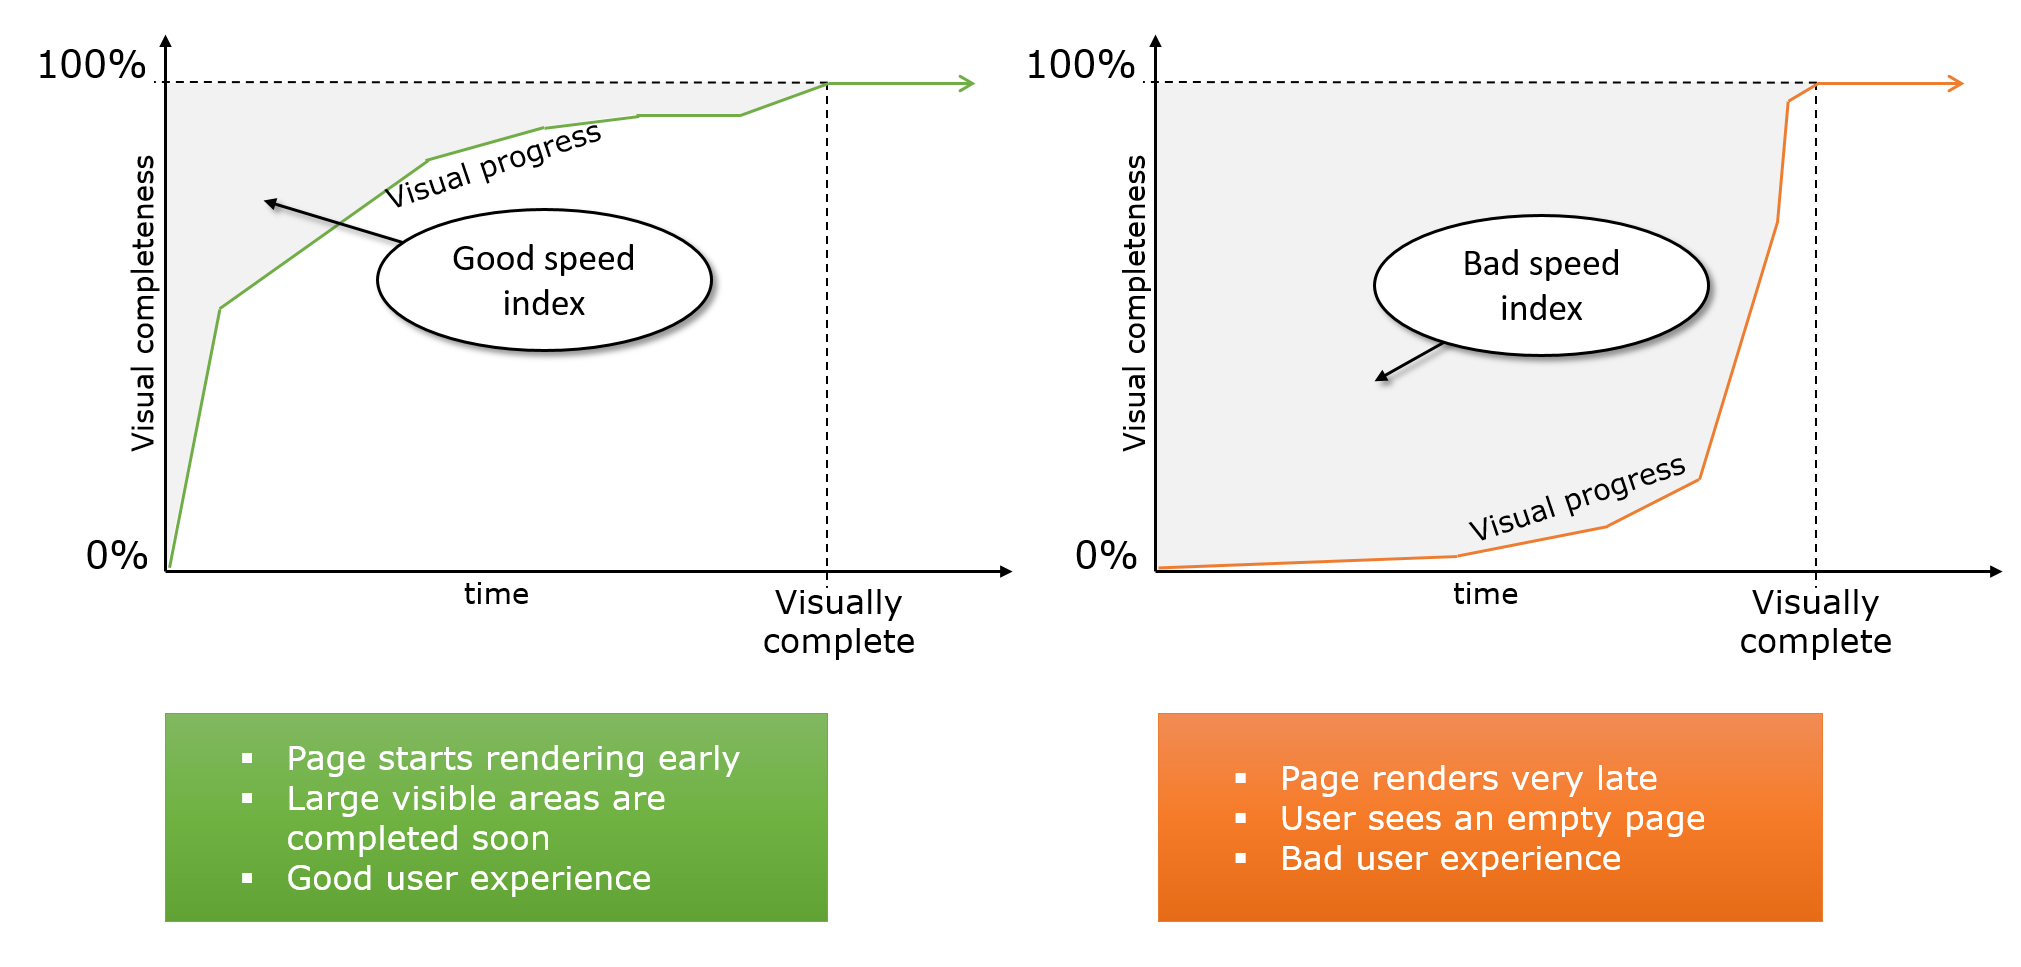
Speed index is a performance metric that measures how quickly a page renders visual elements, from the user’s perspective. This is a rate-of-speed metric that is closely related to Visually complete, which is a moment-in-time measure. A lower Speed index is preferred as it means that large parts of a page render quickly. Speed index, which was introduced by webpagetest.org, takes the “visually complete” concept one step further. Pages that render large visible elements earlier (see example below on the left) receive better scores than pages that render elements slowly (see example below on the right) even when those pages have an identical Visually complete measure.
A milestone for user experience monitoring
There is currently no W3C standard available for capturing metrics that are comparable to Visually complete and Speed index. Until recently, such metrics could only be gathered in synthetic environments where it’s possible to capture screen images during runtime and subsequently process those image. Dynatrace has now found a way of calculating such measures purely in JavaScript by monitoring the DOM—thereby making these metrics available in real user monitoring for the first time. This means that, for the first time, you can capture these metrics in real time and in the real world—no lab setting required.
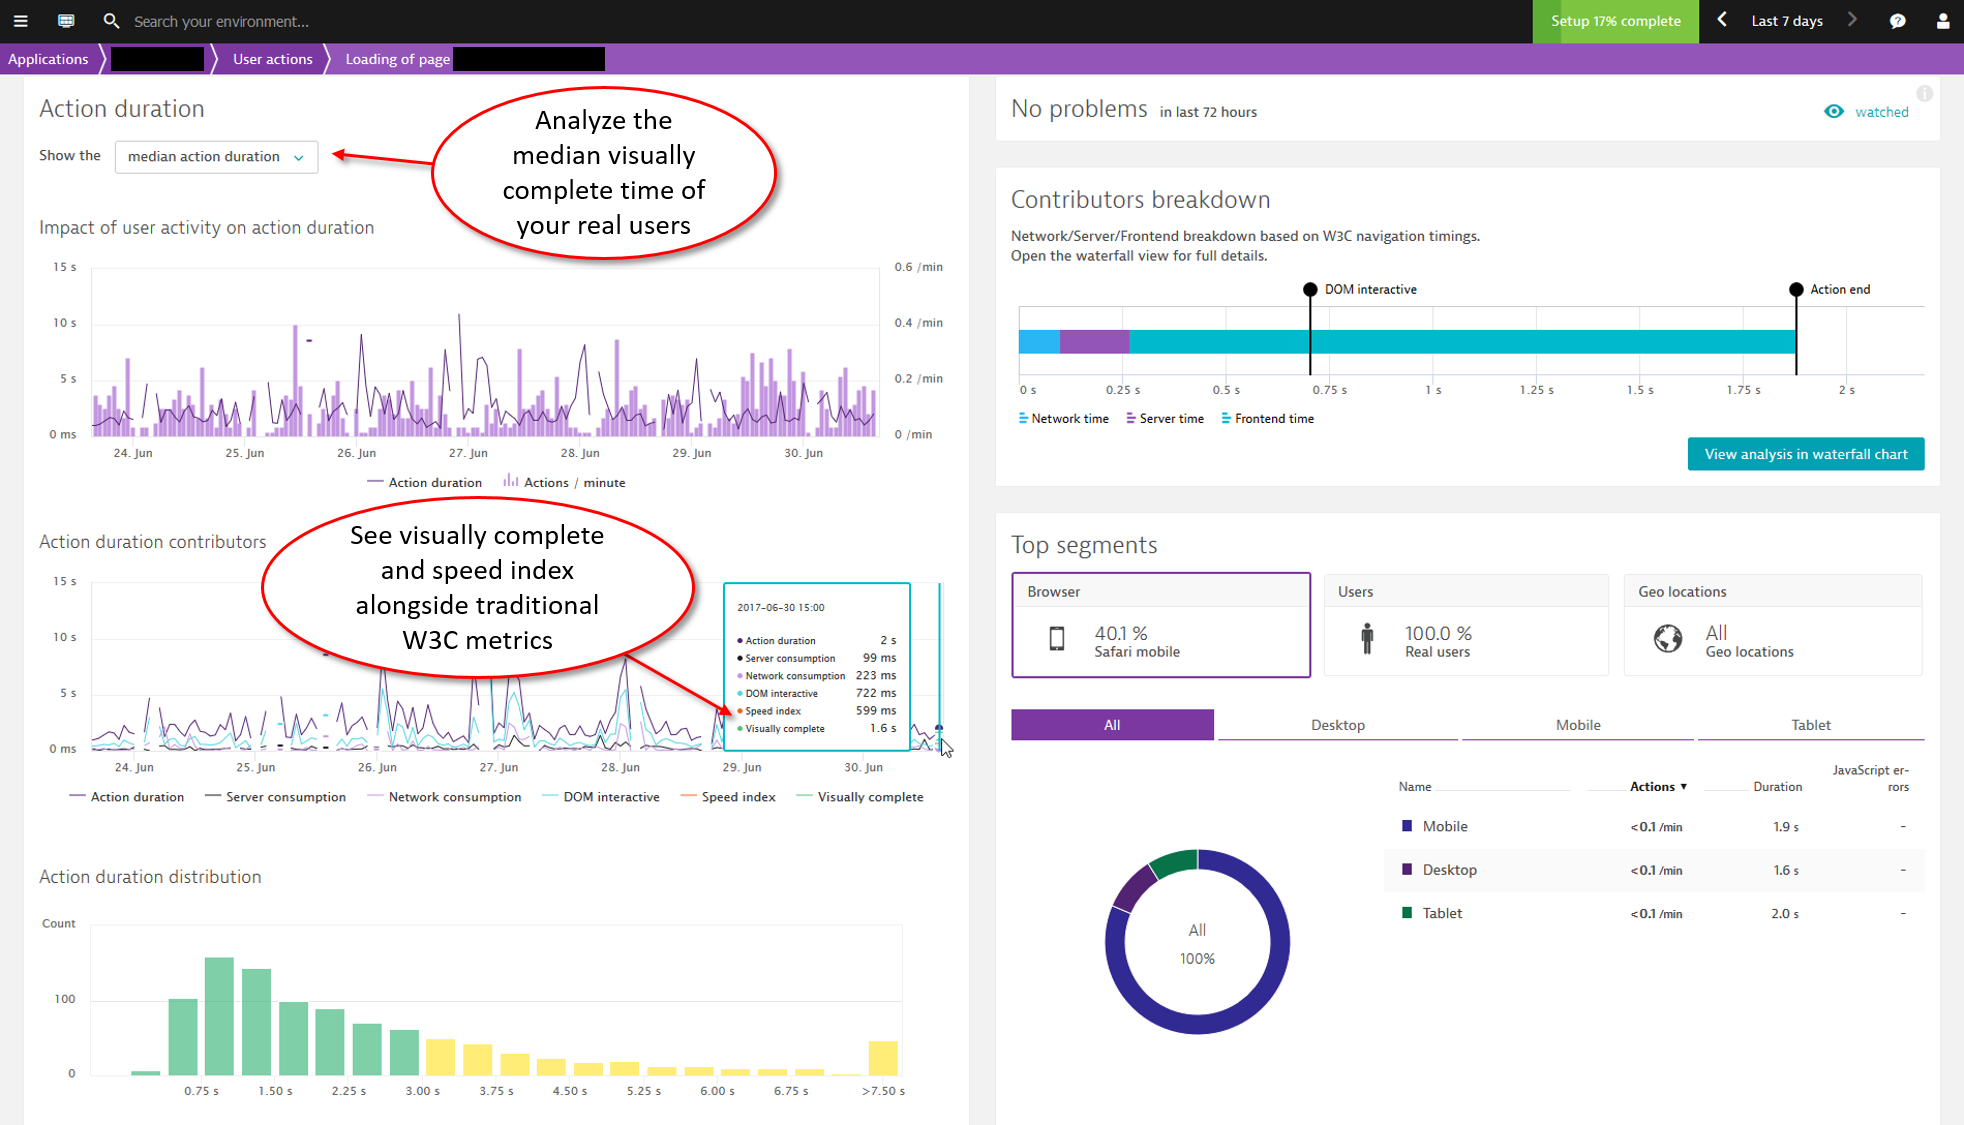
Visually complete and Speed index measures are available for all user actions, across all device types. Wondering how long it takes to load your application’s home page using an old version of the Firefox mobile browser on a budget cell phone? All such metrics are now at your fingertips. No synthetic testing environment required.
Enable Visually complete & Speed index metrics
Visually complete & Speed index metrics are enabled by default in all new installations of Dynatrace. For Dynatrace versions 121 and earlier, these metrics must be enabled manually by doing the following:
- Select Applications from the navigation menu.
- Select the application you want to configure.
- Click the Browse (…) button and select Settings.
- Click the Content capture tab.
- Set the Visually complete and Speed index measures switch to the On position.


Looking for answers?
Start a new discussion or ask for help in our Q&A forum.
Go to forum