Dynatrace OneAgent enables you to track each individual request from end to end. This enables Dynatrace artificial intelligence to automatically identify the root causes of detected problems and to analyze transactions using powerful analysis features like service flow and the service-level backtrace. Dynatrace enables you to efficiently find the proverbial needle in the haystack and focus on those few requests (out of tens of thousands) that you’re interested in. The next step is to analyze each of these requests separately to understand the flow of each transaction through your service landscape. Meet PurePath. PurePath technology is at the heart of what we do.
How to locate a single request
The first step in your analysis should be to locate those requests that you want to analyze at a granular level. Filters can be used to narrow down many thousands of requests to just those few requests that are relevant to your analysis. This can be achieved during problem analysis by following the root-cause analysis drill downs (select Problems from the navigation menu to start problem analysis), or manually by segmenting your requests using the advanced filtering mechanisms in service flow and outlier analysis. Ultimately, you’ll likely discover a handful of requests that require deeper analysis. This is where PurePath analysis comes in.
In the example below, the service easyTravel Customer Frontend received 138,000 service requests during the selected 2-hour time frame. This is an unwieldy number of requests to work with, so we need to narrow down these results.
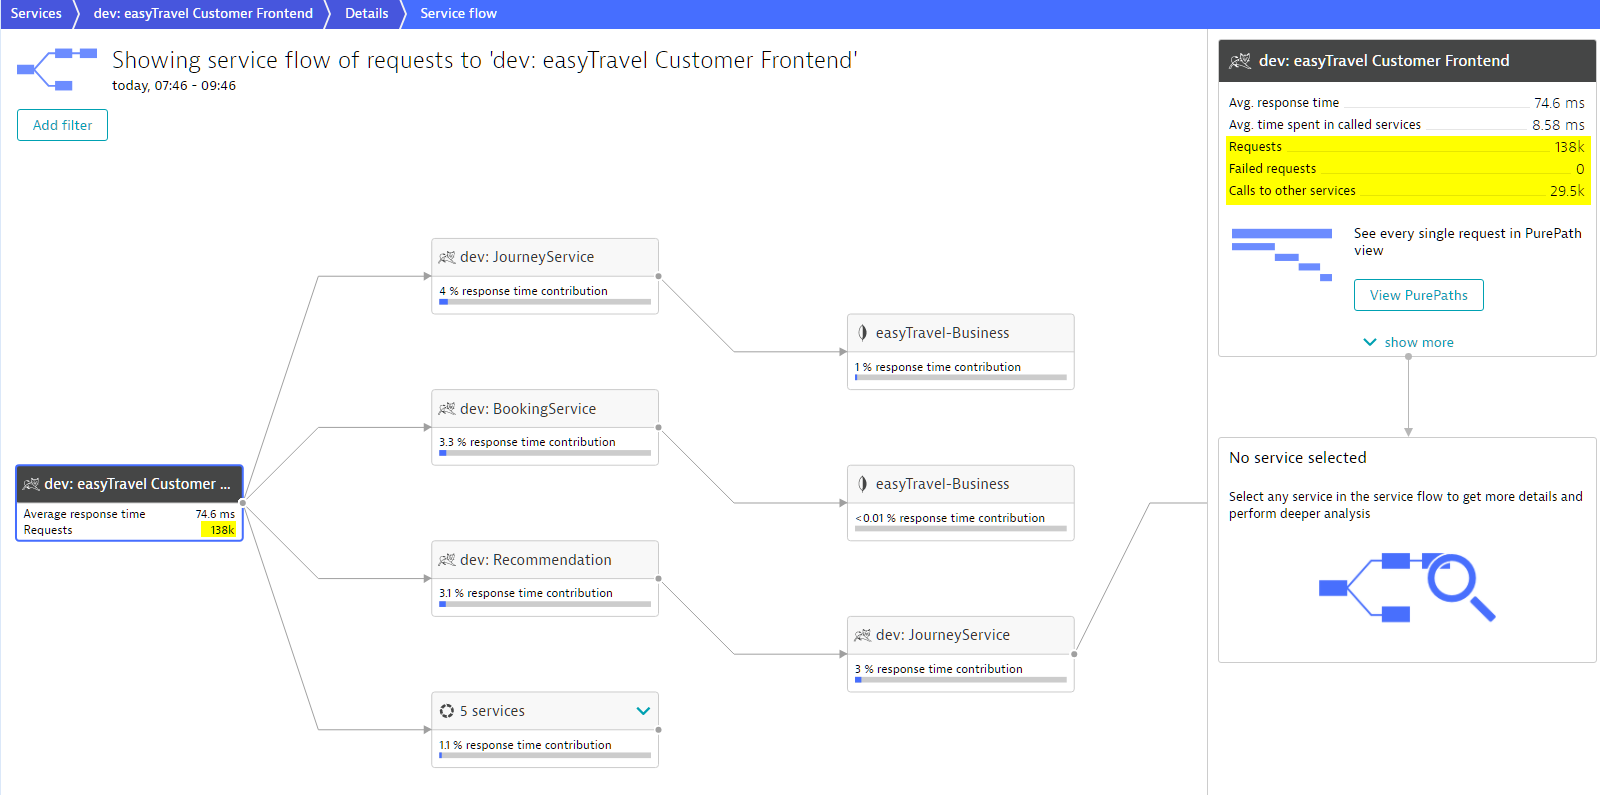
We’re interested specifically in those requests that call the Authentication Service. There are only 656 of these. To focus on this subset of requests click the Filter service flow button after selecting the desired chain of service calls that you want to look at.
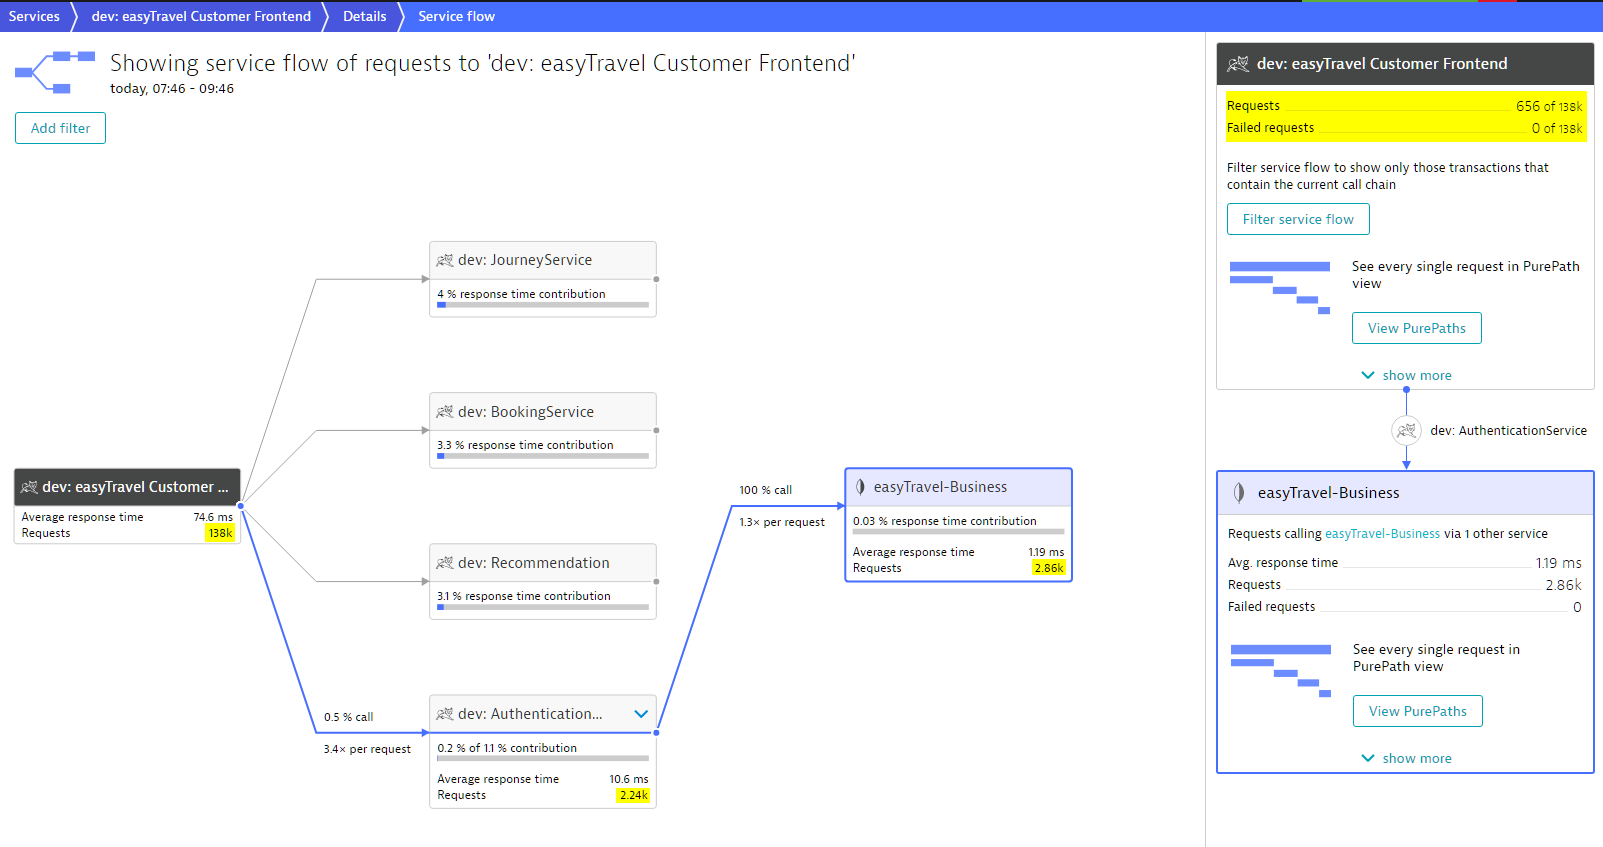
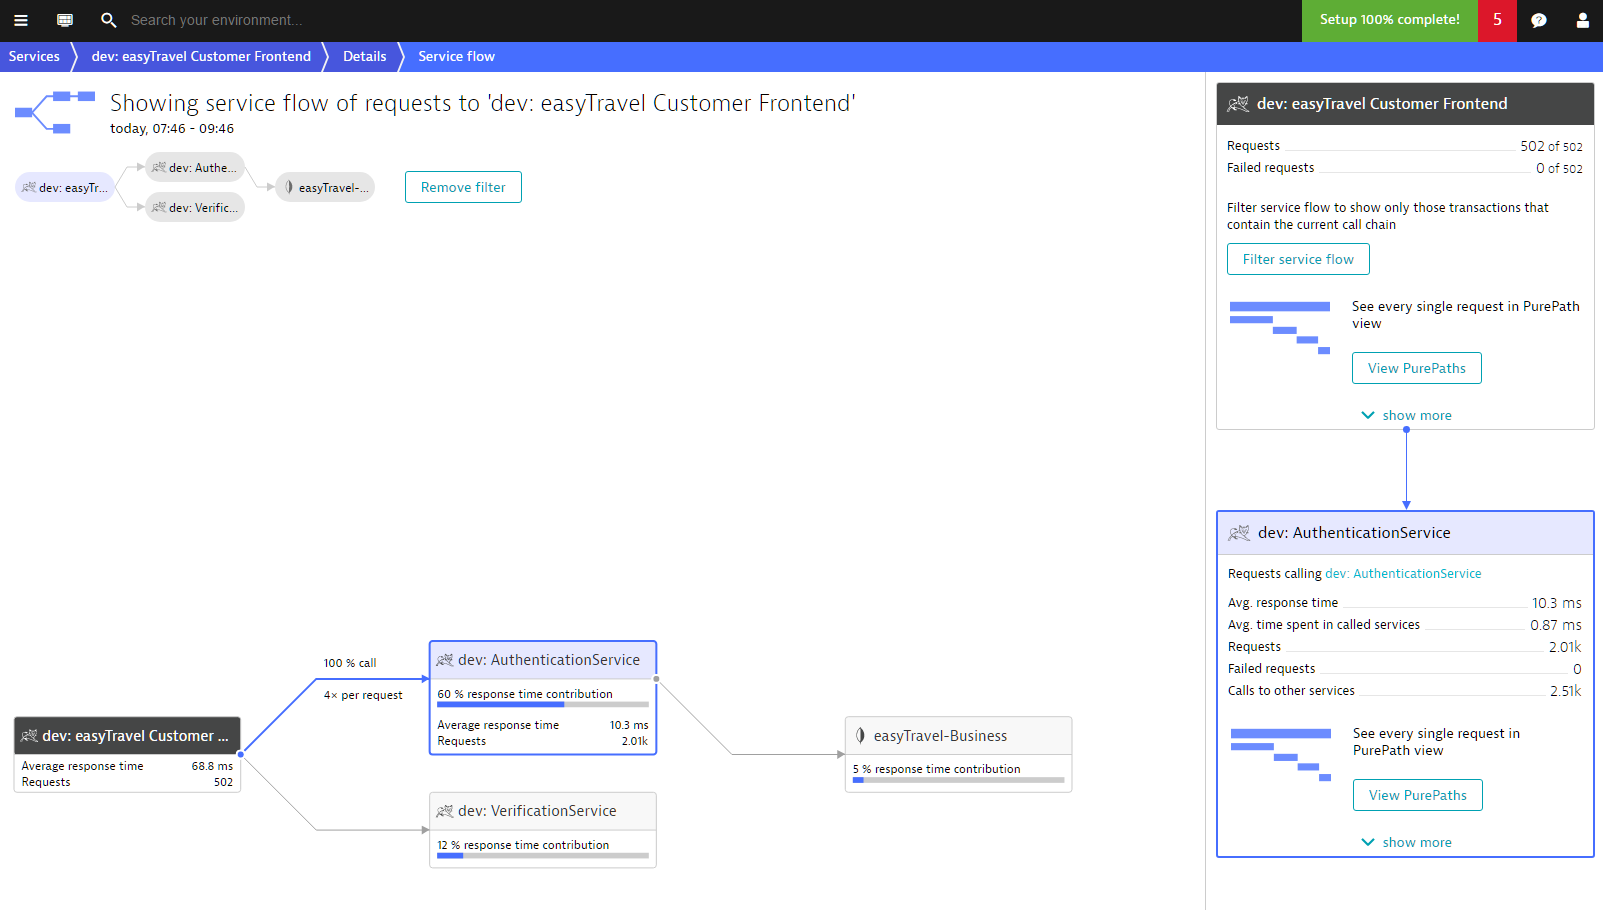
Notice the hierarchical filter; it shows that we are looking only at transactions where the easyTravel Customer Frontend calls the Authentication Service which in turn calls the easyTravel-Business MongoDB
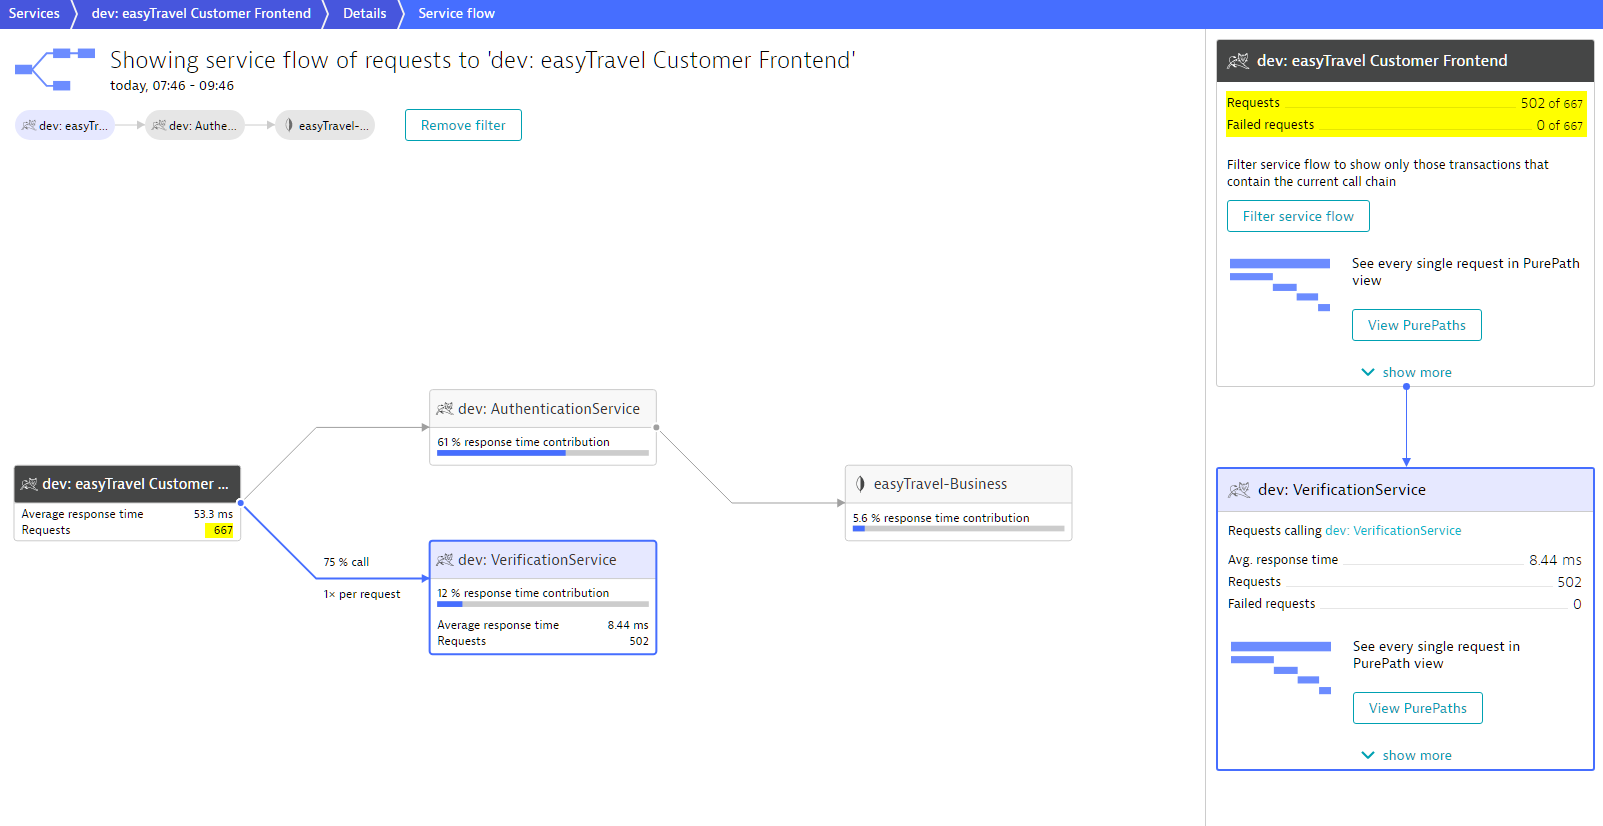
Now we can see that 75% of the easyTravel Custom Frontend requests that call the Authentication Service also call the Verification Service. These are the requests we want to focus our analysis on. So let’s add the Verification Service as a second filter parameter to further narrow down the analysis. To do this we simply select the Verification Service and then click the View Purepath button in the upper right box.
Notice the filter visualization in the upper left corner of the example below. The provided PurePath list includes only those requests to the Customer Frontend that call both the Authentication Service and the Verification Service.
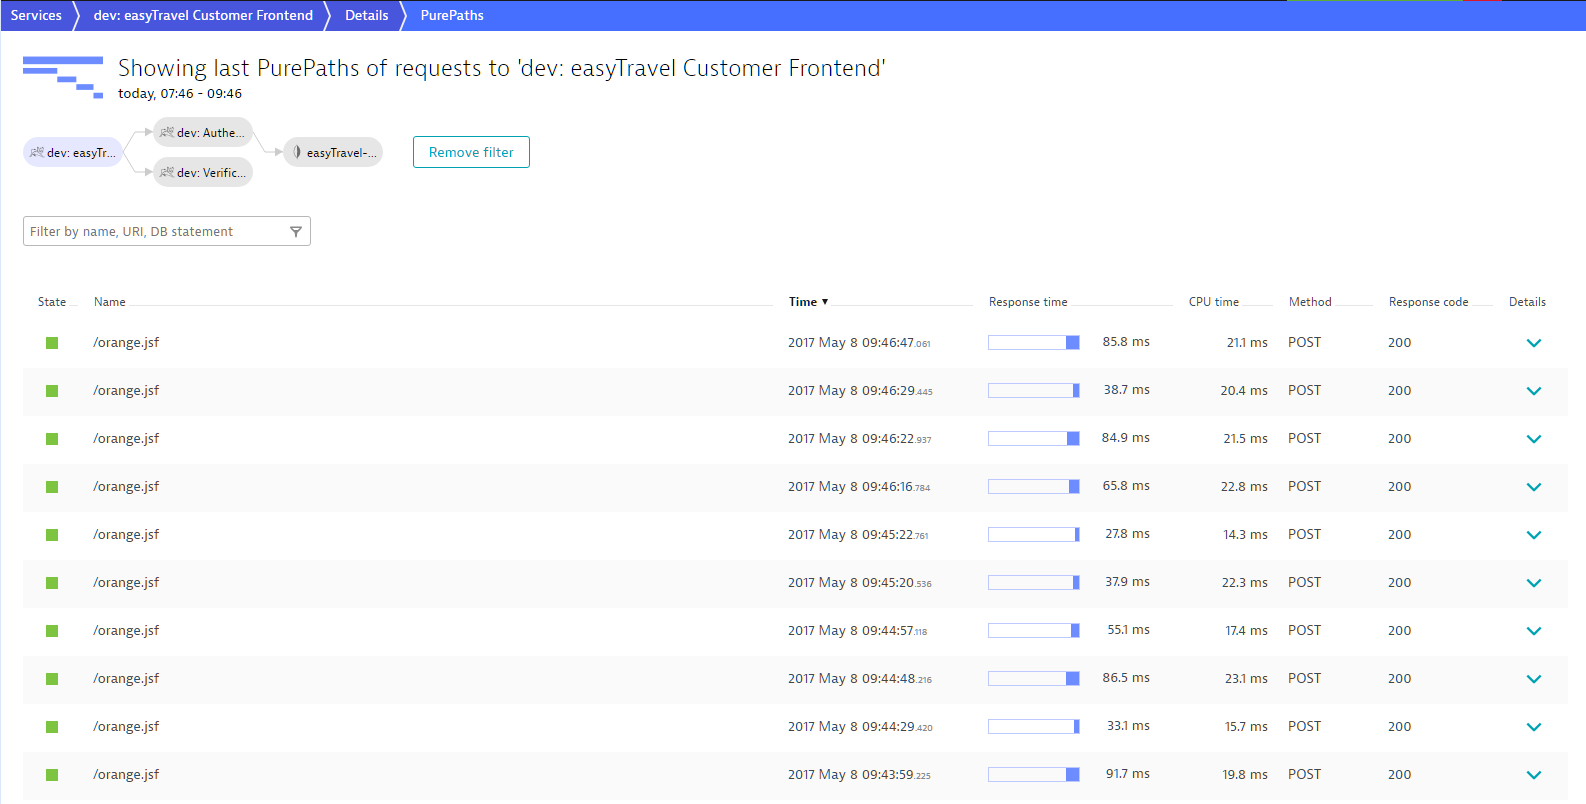
But the list is still too large—we only need to analyze the slower requests. To do this, let’s modify the filter on the easyTravel Customer Frontend node so that only those requests that have Response time > 500 ms are displayed.
As you can see below, after applying the response time filter, we’ve identified 4 requests out of 138,000 that justify in-depth PurePath analysis.
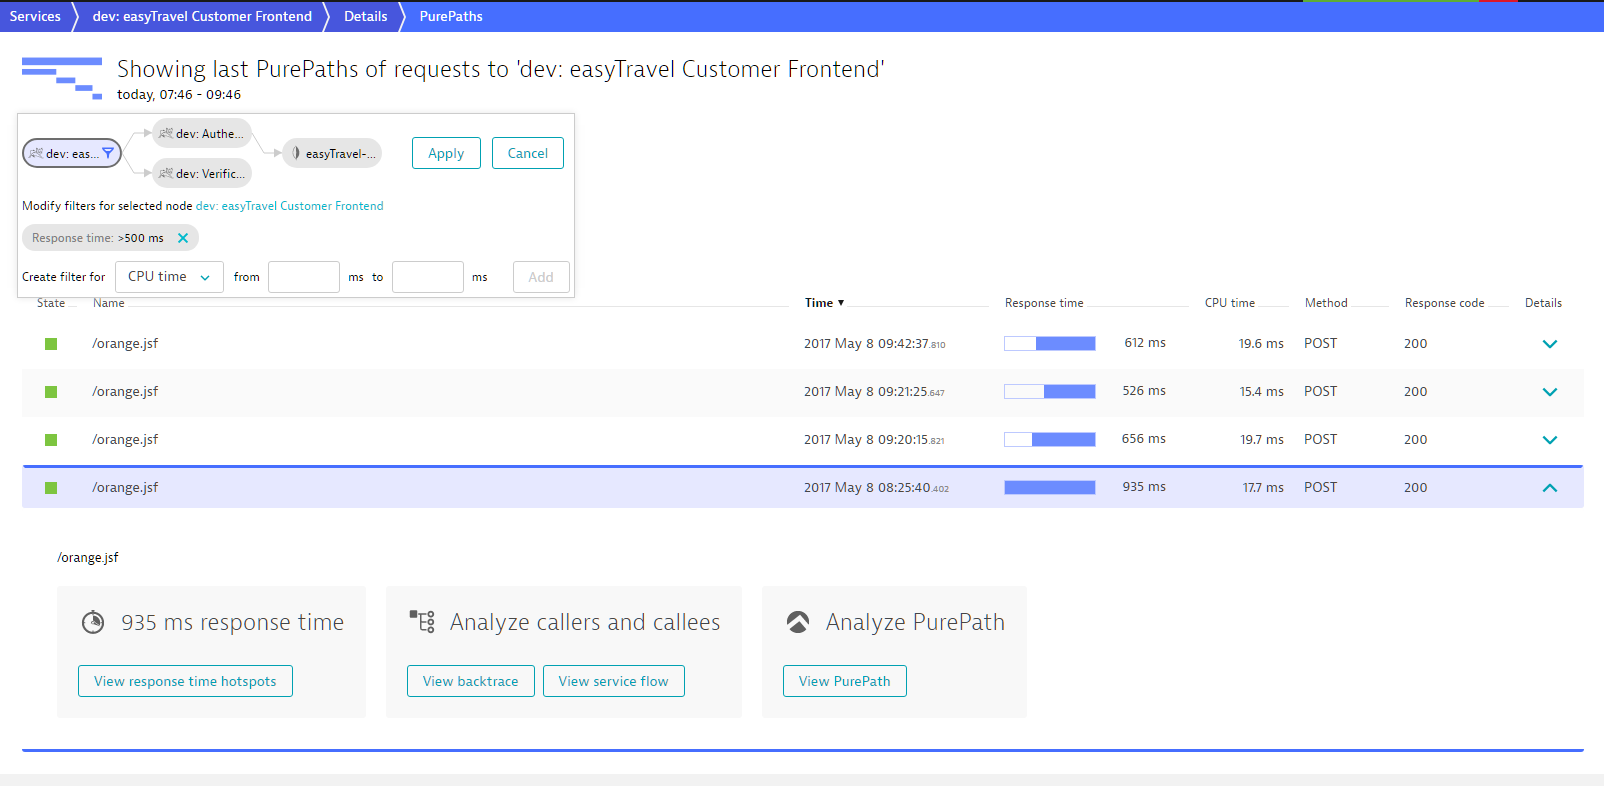
To begin PurePath analysis of this request, click the View PurePath button.
PurePath analysis of a single web request
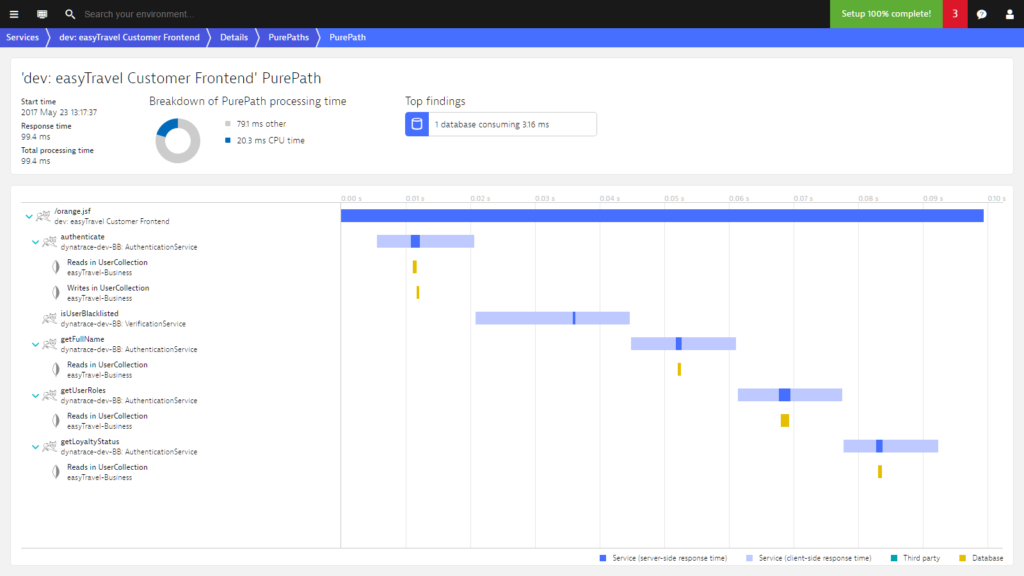
Dynatrace traces all requests in your environment from end to end. Have a look below at the waterfall visualization of a request to the Customer Frontend. Each service in the call chain is represented here.
The top section of the example PurePath above tells us that the whole transaction consumes about 20 ms of CPU and spends time in 1 database. However the waterfall chart shows much more detail. The waterfalls shows which other services are called and in which order. We can see each call to the Authentication and Verification services. We also see the subsequent calls to the MongoDB that were made by both service requests. PurePath, like the Service Flow, provides end-to-end web request visualizations—in this case that of a single request.
The bars indicate both the sequence and response time of each of the requests. The different colors help to easily identify the type of call and timing. This allows you to see exactly which calls were executed synchronously and which calls were executed in parallel. It also enables us to see that most of the time of this particular request was spent on the client side of the isUserBlocklisted Webservice call. As indicated by the colors of the bars in the chart, the time is not spent on the server side of this webservice (dark blue) but rather on the client side. If we were to investigate this call further, we would see underlying network latency.
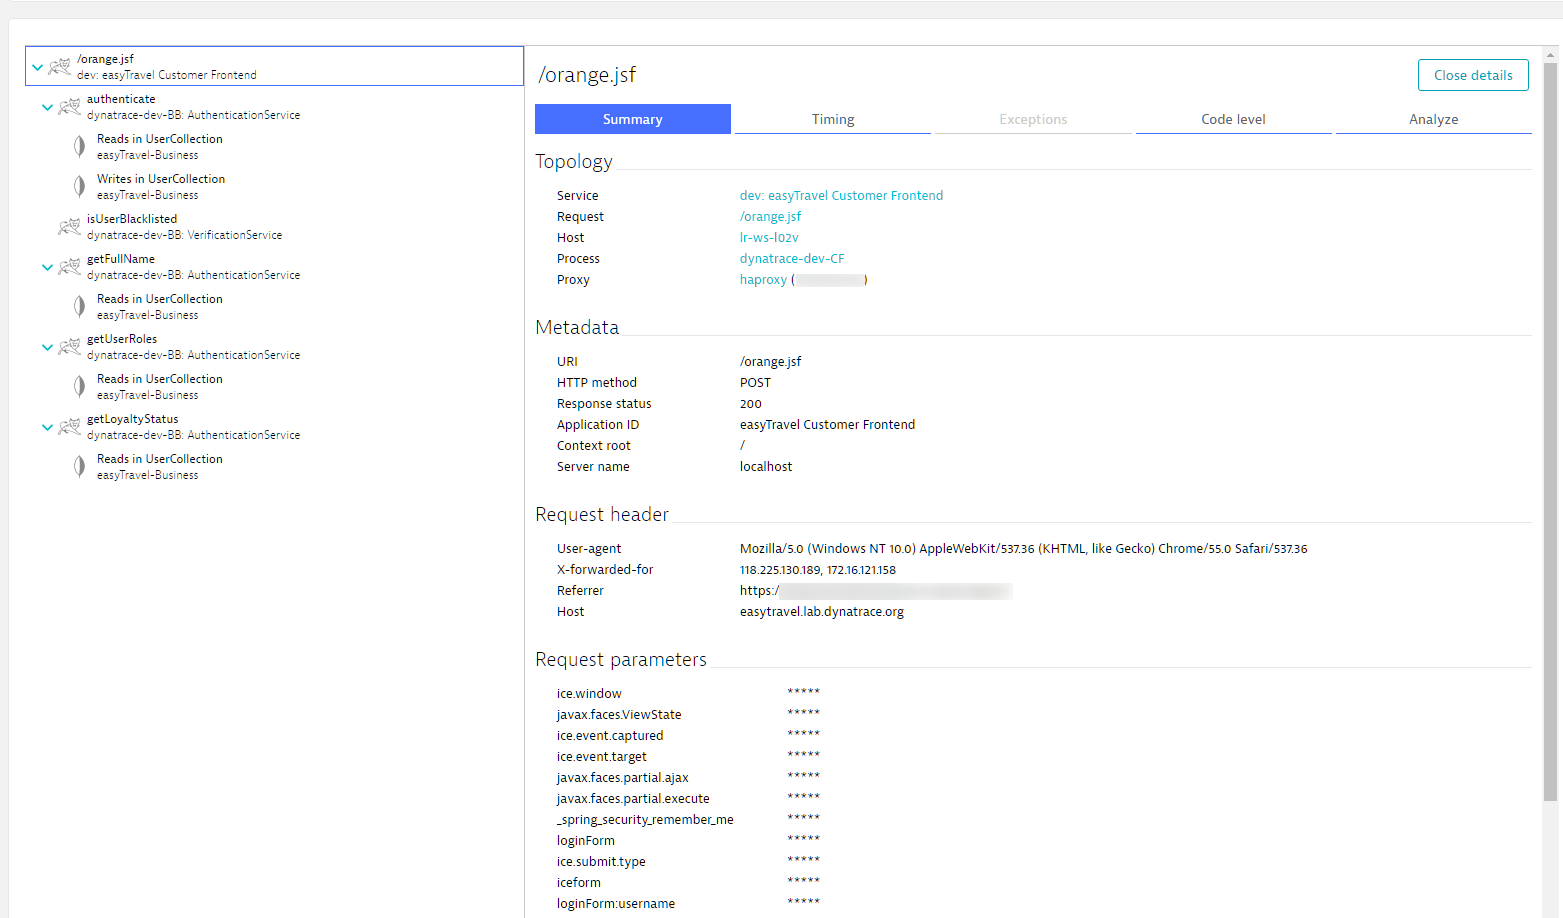
By selecting one of the services or execution bars you can get even more detail. You can analyze the details of each request in the PurePath. In the example below, you can see the web request details of the main request. You can view the metadata, request headers, request parameters, and more. You can even see information about the proxy that this request was sent through.
Notice that some values are obscured with asterisks. This is because these are confidential values and this user doesn’t have permission to view confidential values. These values would be visible if the active user had permission to view these values.
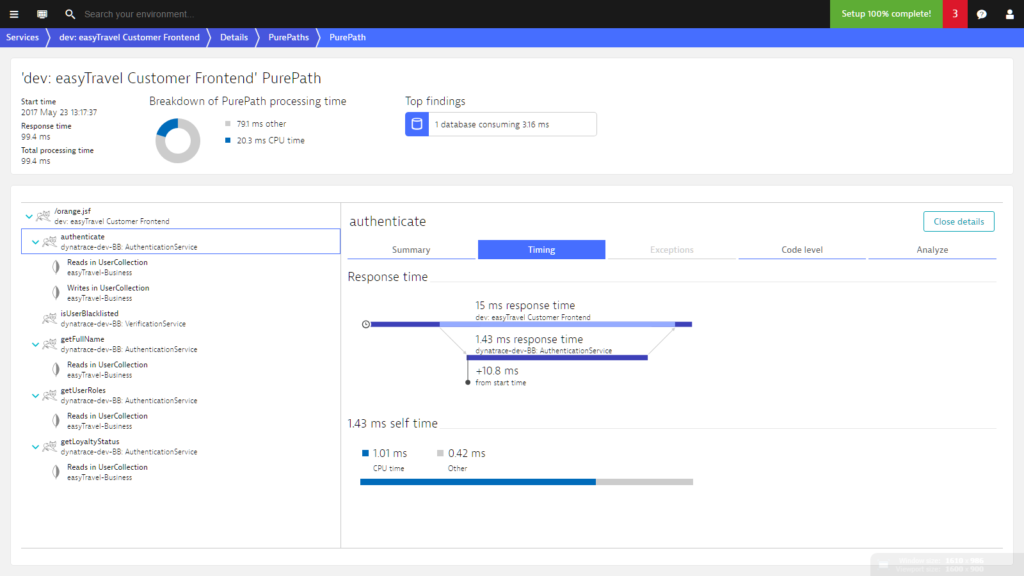
The same is true for all subsequent requests made by the initial request. The image below shows the authenticate web service call. Besides the metadata provided on the Summary tab, you also get more detail about timings. In this case, we see that the request lasts 15ms on the calling side but only 1.43ms on the server side. Here again, there is significant network latency.
Code execution details of individual requests
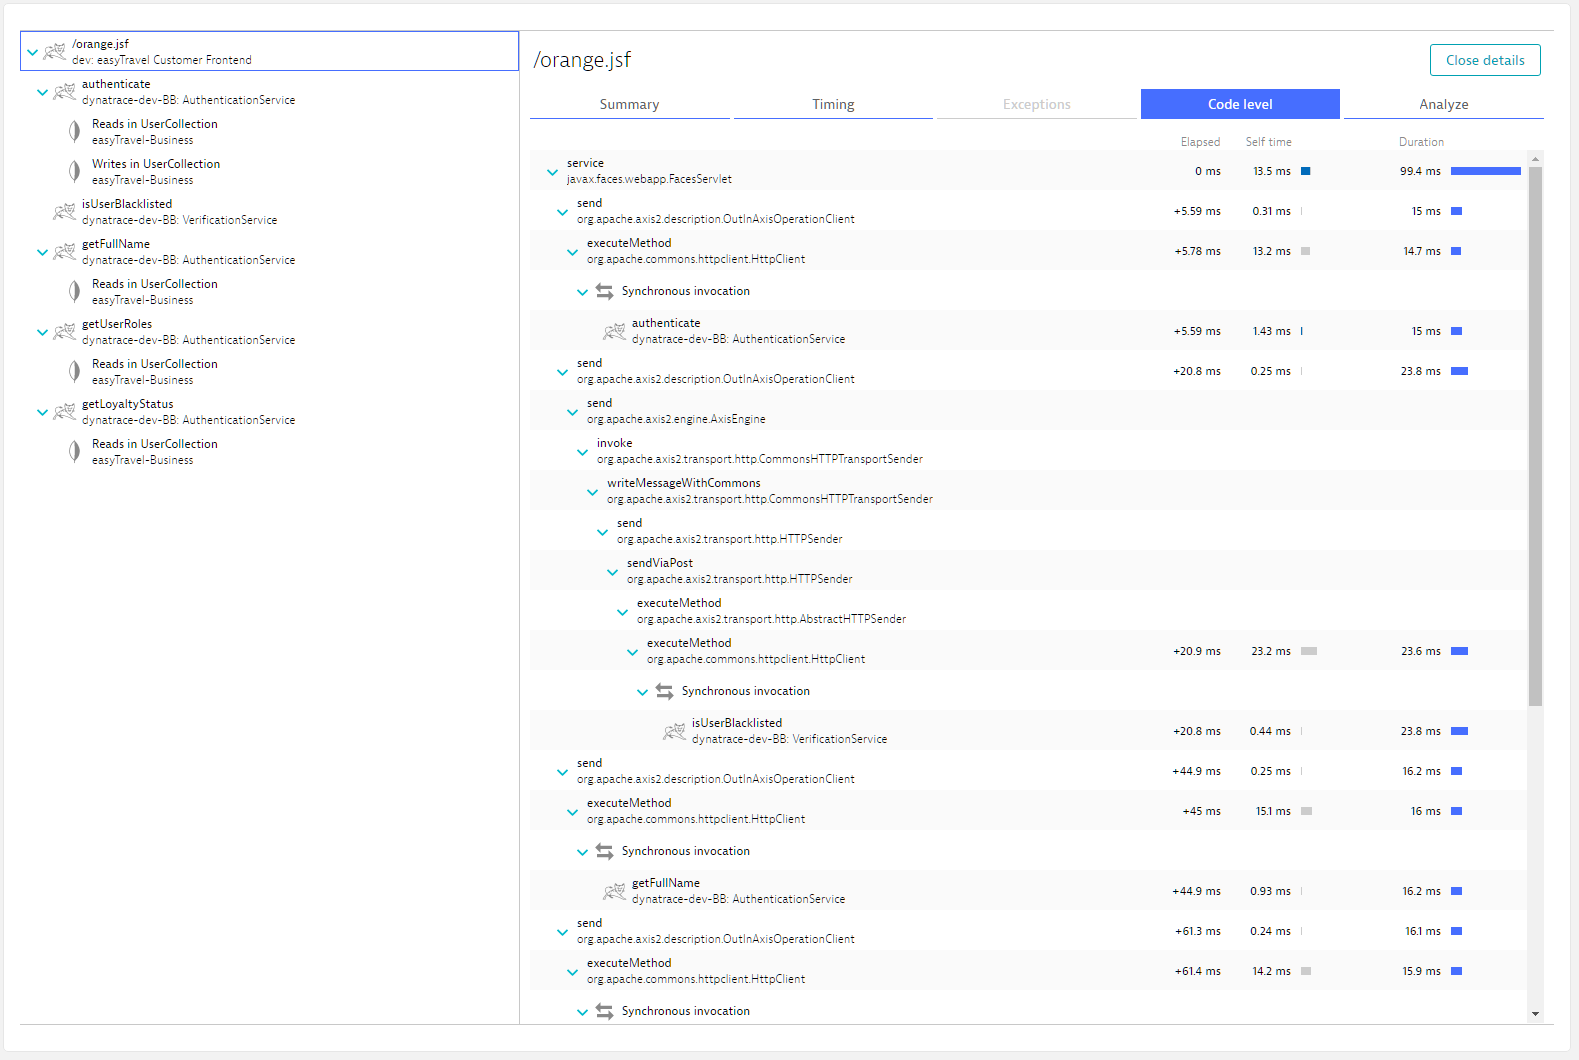
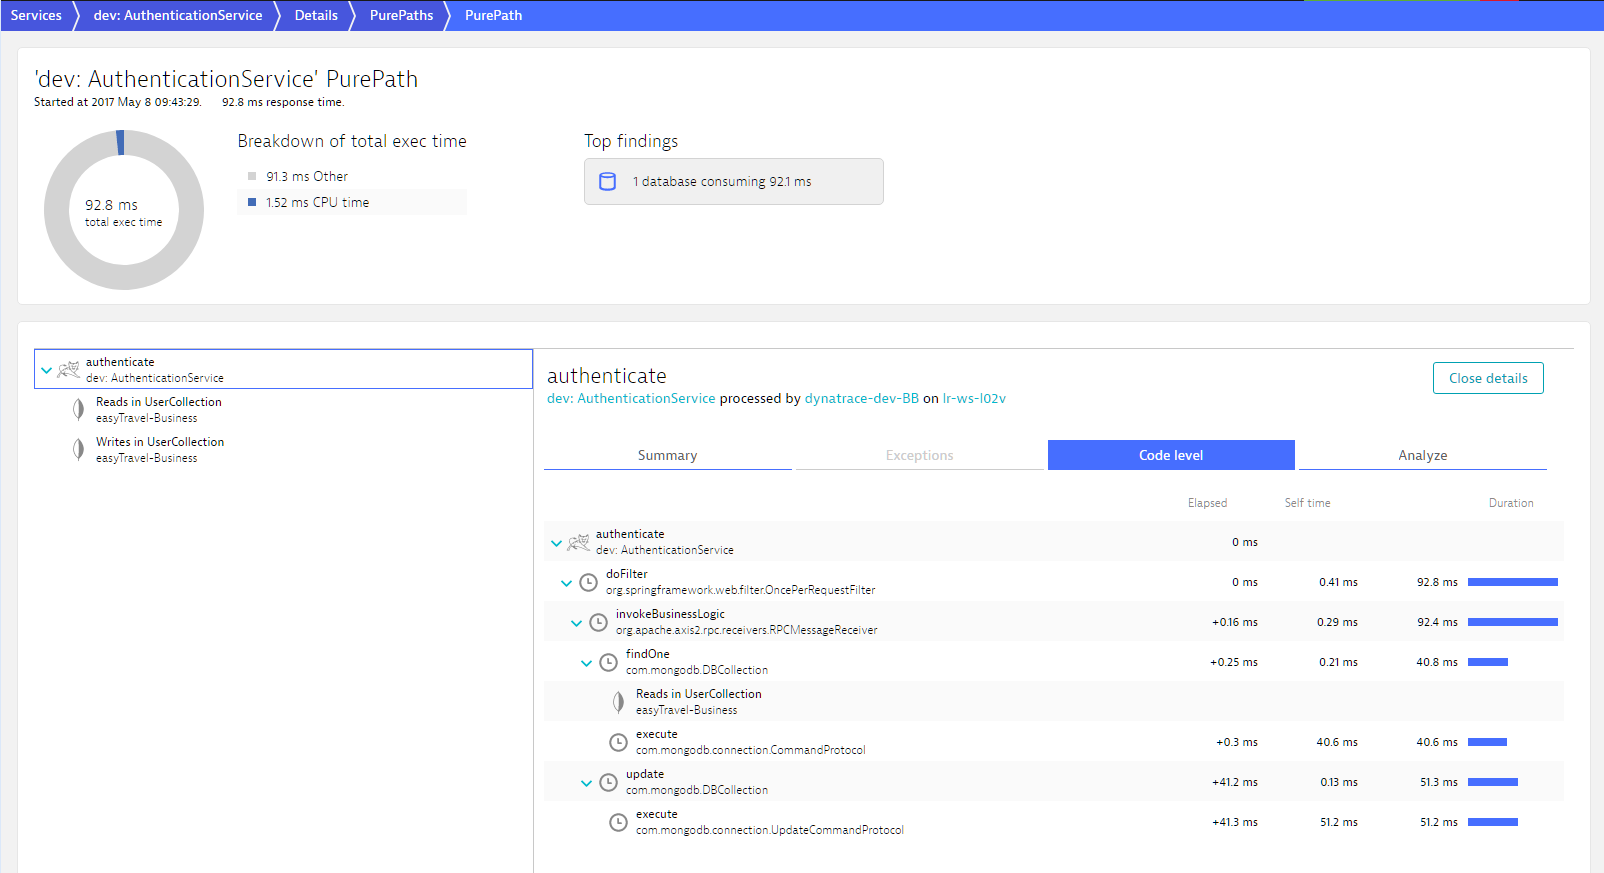
Each request executes some code, be it Java, .NET, PHP, Node.js, Apache webserver, Nginx, IIS or something else. PurePath view enables you to look at the code execution of each and every request. Simply click on a particular service and select the Code level tab.
Code level view shows you code level method executions and their timings. Dynatrace tells you the exact sequence of events with all respective timings (for example, CPU, wait, sync, lock, and execution time). As you can see above, Dynatrace tells you exactly which method in the orange.jsf request on the Customer Frontend called the respective web services and which specific web service methods that were called. The timings displayed here are the timings as experienced by the Customer Frontend, which, in the case of calls to services on remote tiers, represent the client time.
Notice that some execution trees are more detailed than others. Some contain the full stacktrace while others only show neuralgic points. Dynatrace automatically adapts the level of information it captures based on importance, timing, and estimated overhead. Because of this, slower parts of a request typically contain more information than faster parts.
You can look at each request in the Purepath and navigate between the respective code level trees. This gives you access to the full execution tree.
Error analysis
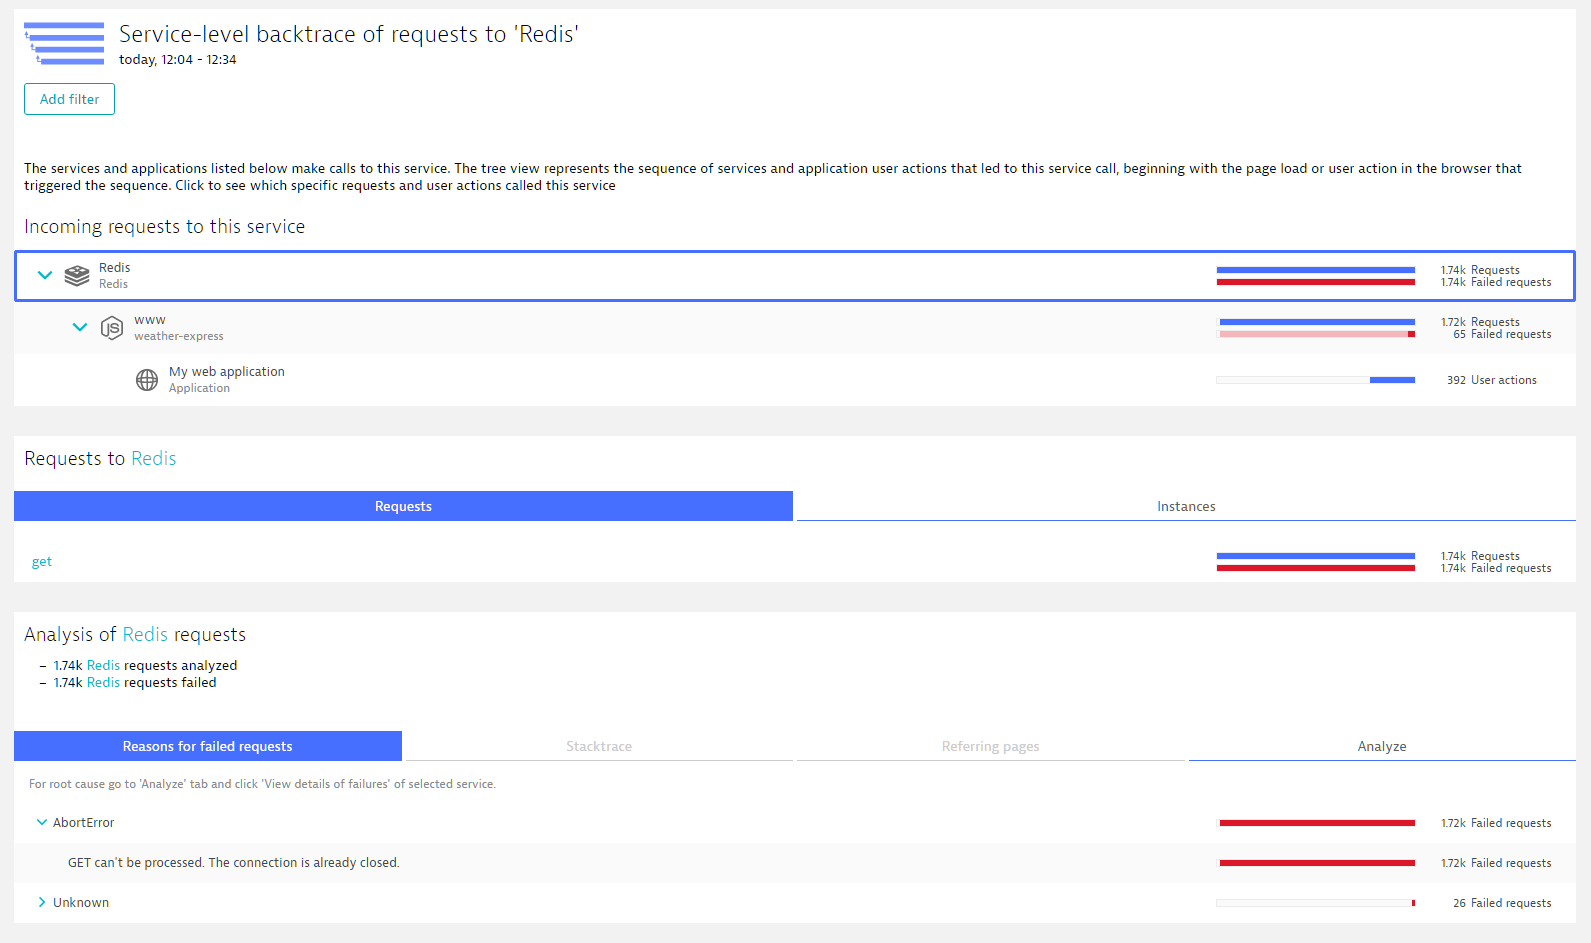
Analyzing individual requests is often a useful way of gaining a better understanding of detected errors. In the image below you can see that requests to Redis started to fail around the 10:45 mark on the timeline.
By analyzing where these requests came from we can see that all of these requests originate in the Node.js weather-express service. We also see that nearly all failed Redis calls have the same Exception: an AbortError caused by a closed connection.
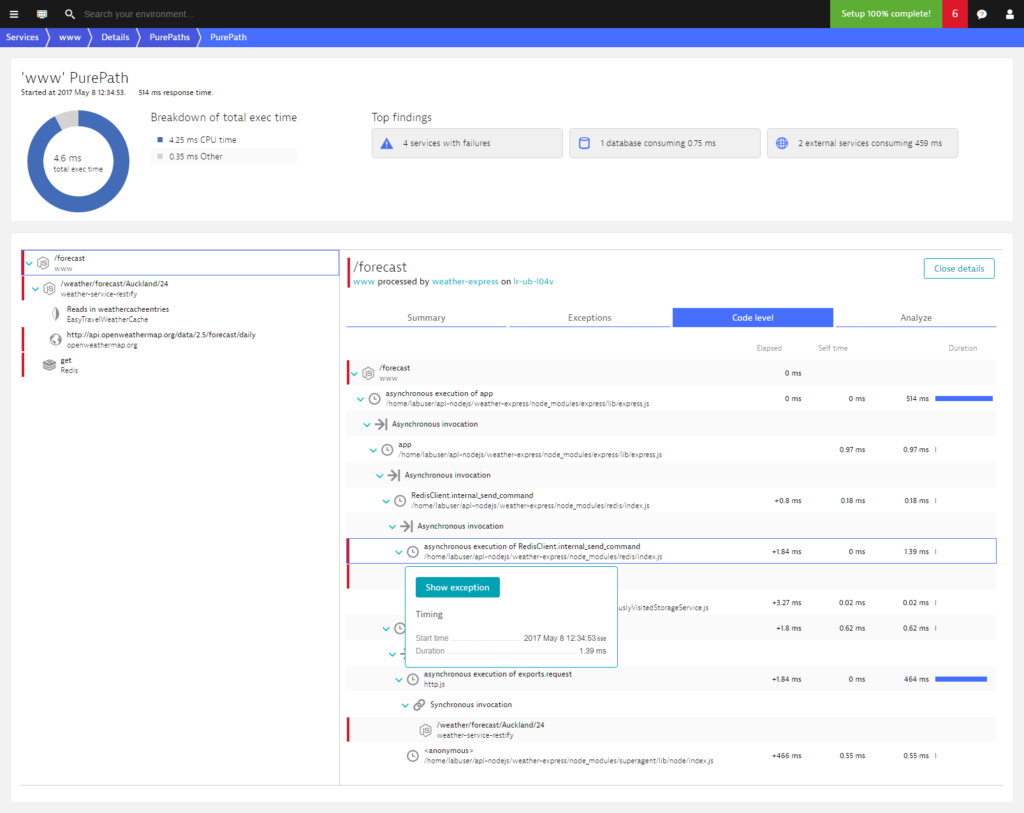
We can go one step further, down to the affected Node.js PurePaths. Below you can see such a Node.js PurePath and its code level execution tree. Notice that the Redis method call leads to an error. You can see where this error occurs in the flow of the Node.js code.
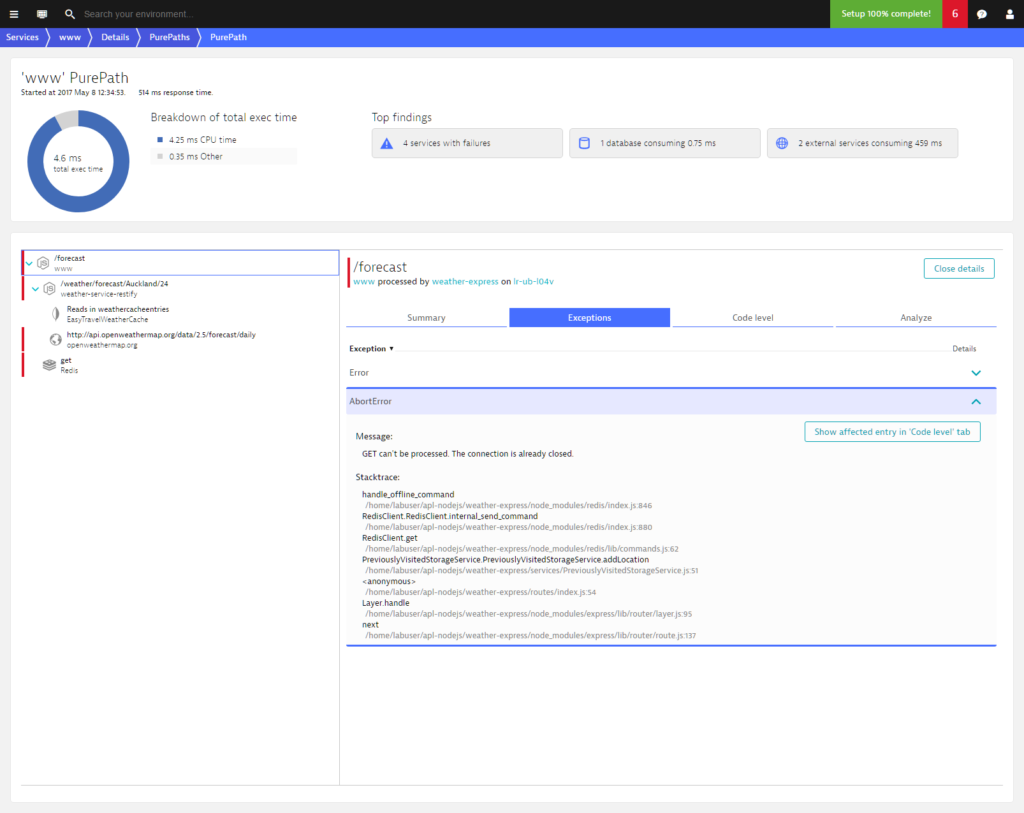
We can also analyze the exception that occurs at this point in the request.
Each PurePath shows a unique set of parameters leading up to the error. With this approach to analysis, PurePath view can be very useful in helping you understand why certain exceptions occur.
Different teams, different perspectives
Each PurePath tracks a request from start to finish. This means that PurePaths always start at the first fully monitored process group. However, just because a request starts at the Customer Frontend service doesn’t mean that this is the service you’re interested in. For example, if you’re responsible for the Authentication Service, it makes more sense for you to analyze requests from the perspective of the Authentication service.
Let’s look at the same flow once again, but this time we’ll look at the requests of the Authentication Service directly. This is done by clicking the View PurePaths button in the Authentication service box.
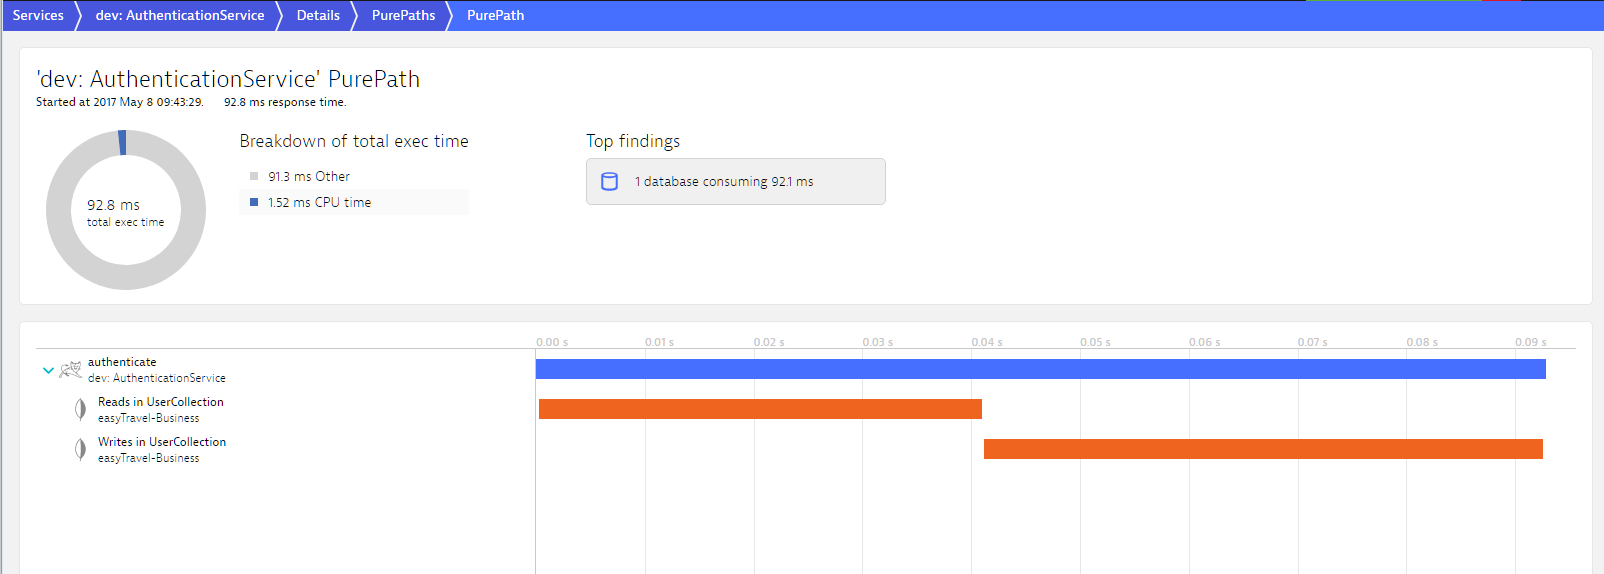
We can additionally add a response time filter. With this adjustment, the list now only shows Authentication requests that are slower than 50ms that are called by the Customer Frontend service (at the time when the frontend request also calls the Verification service).
Now we can analyze the Authentication service without including the Frontend service in the analysis. This is useful if you’re responsible for a service that is called by the services developed by other teams.
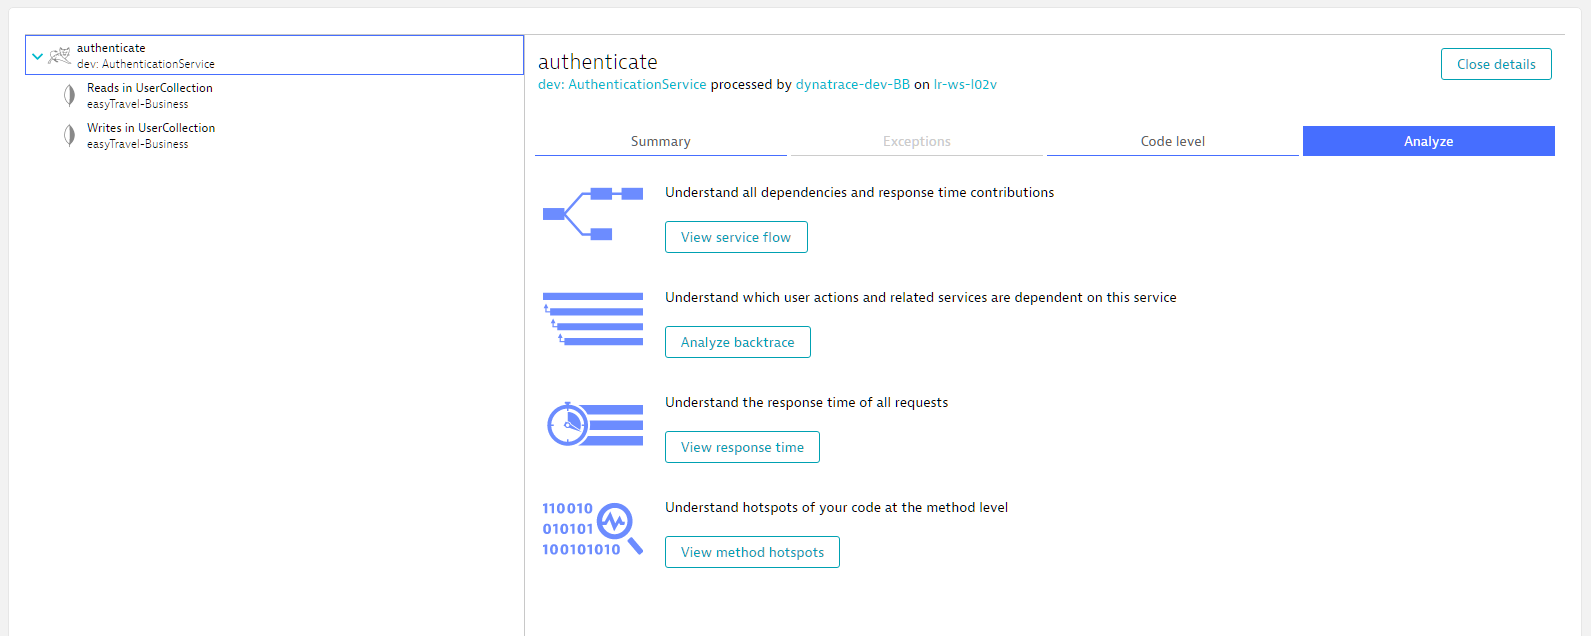
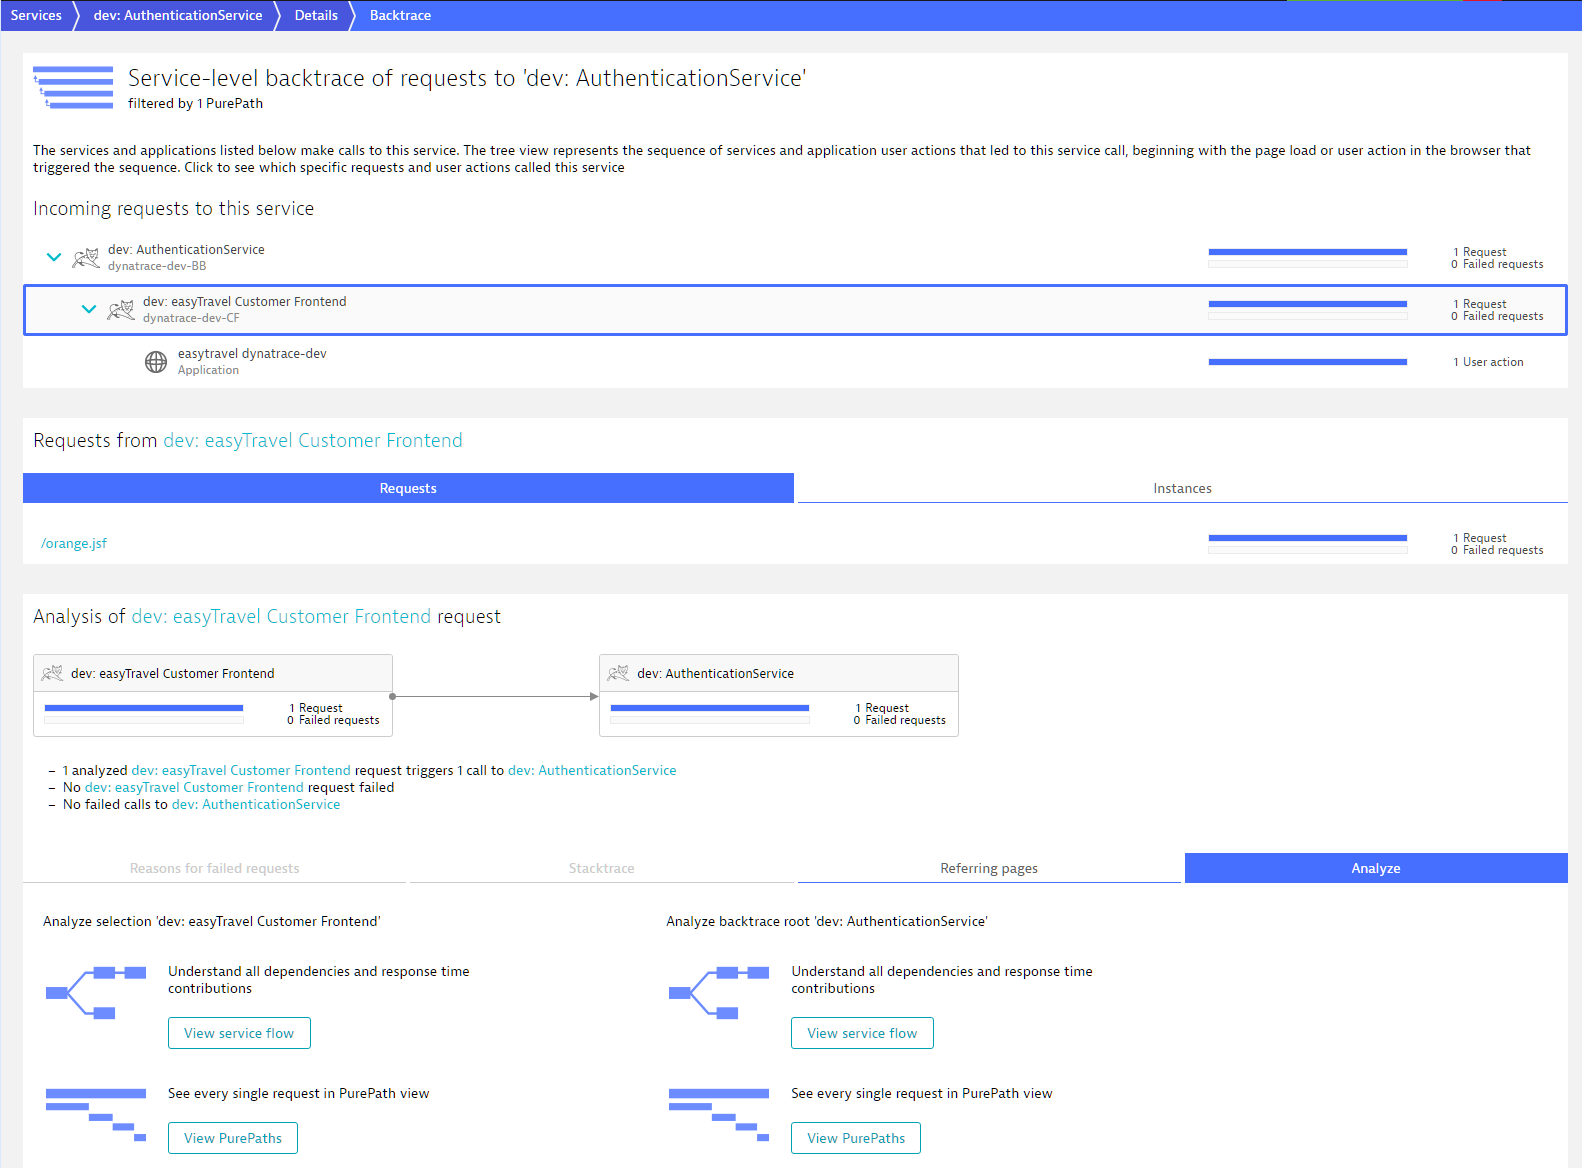
Of course, if required, we can use service backtrace at any time to see where this request originated.
We can then choose to once again look at the same PurePath from the perspective of the Customer Frontend service.
This is the same Purepath we began our analysis with. You can still see the Authenticate call and its two database calls, but now the call is embedded in a larger request.
The power of Dynatrace PurePath
As you can see, Dynatrace PurePath enables you to analyze systems that process many thousands of requests per minute, helping you to find the “needle in the haystack” that you’re looking for. You can view requests from multiple vantage points—from the perspective of the services you’re responsible for, or from the point of view of where a request originates in your system. With PurePath, you really do get an end-to-end view into each web request.







Looking for answers?
Start a new discussion or ask for help in our Q&A forum.
Go to forum