Dynatrace support for Cloud Foundry applications has been available for some time now, helping application teams better understand and optimize their distributed microservices environments. As we work tirelessly to provide you with full insights into your technology stack, I’m happy to announce that Dynatrace is the first monitoring solution to provide full-stack insights into Cloud Foundry clusters — automatically and with no configuration. This includes monitoring of both Cloud Foundry cluster health for platform and resource optimization, and automatic monitoring of your deployed applications.
Cloud Foundry cluster health monitoring
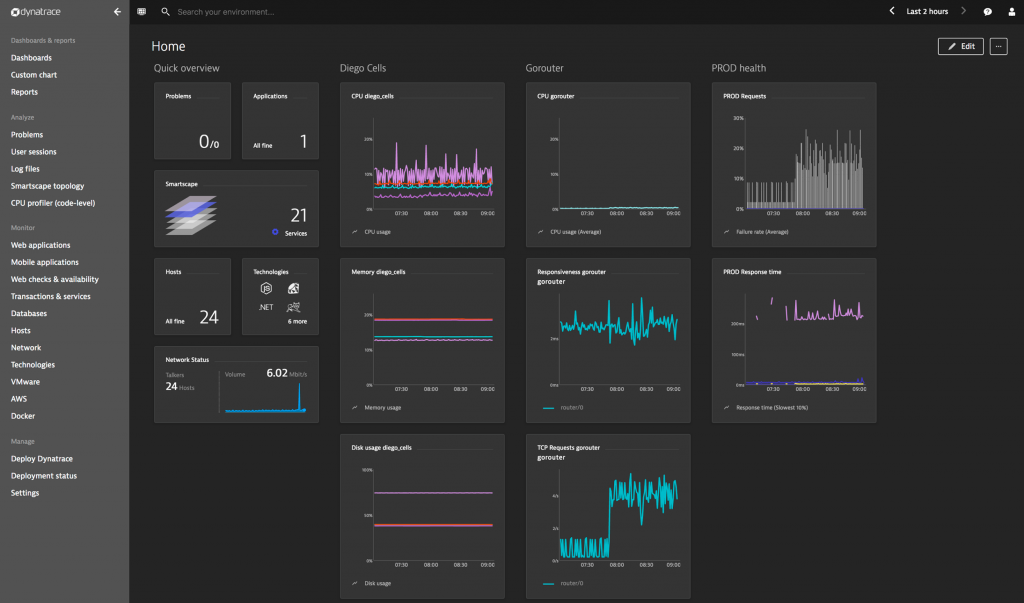
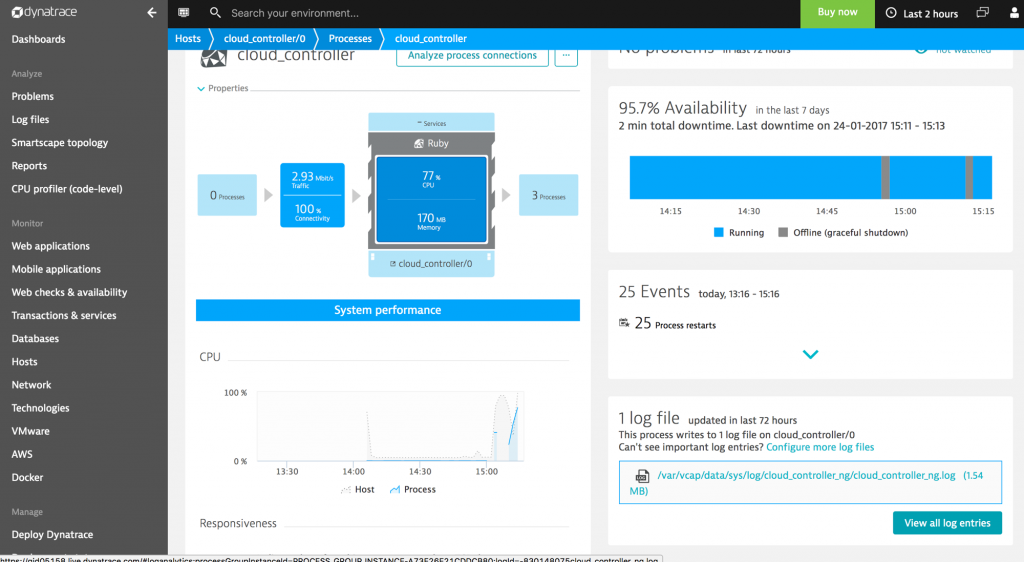
By deploying Dynatrace OneAgent to your Cloud Foundry VMs, you gain monitoring insights into all Cloud Foundry components, including Diego Cells, Cloud Controller, Gorouter, and more. With these capabilities, Dynatrace enables you to optimize your cluster component sizing, detect failing or under-provisioned components, and leverage AI-powered analytics throughout your entire stack.

Deploying OneAgent to your cluster components gives you health metrics for each VM, including CPU usage, Disk IO, Network IO. It even provides insight into the quality of the network communication of the processes between your Cloud Foundry components.

Automatic monitoring of Cloud Foundry applications, down to the code and query level
Dynatrace full-stack monitoring for Cloud Foundry environments includes built-in auto-injection for Garden-runC containers. This means that Dynatrace OneAgent auto-detects each application that’s deployed to Cloud Foundry and automatically initiates deep application monitoring.
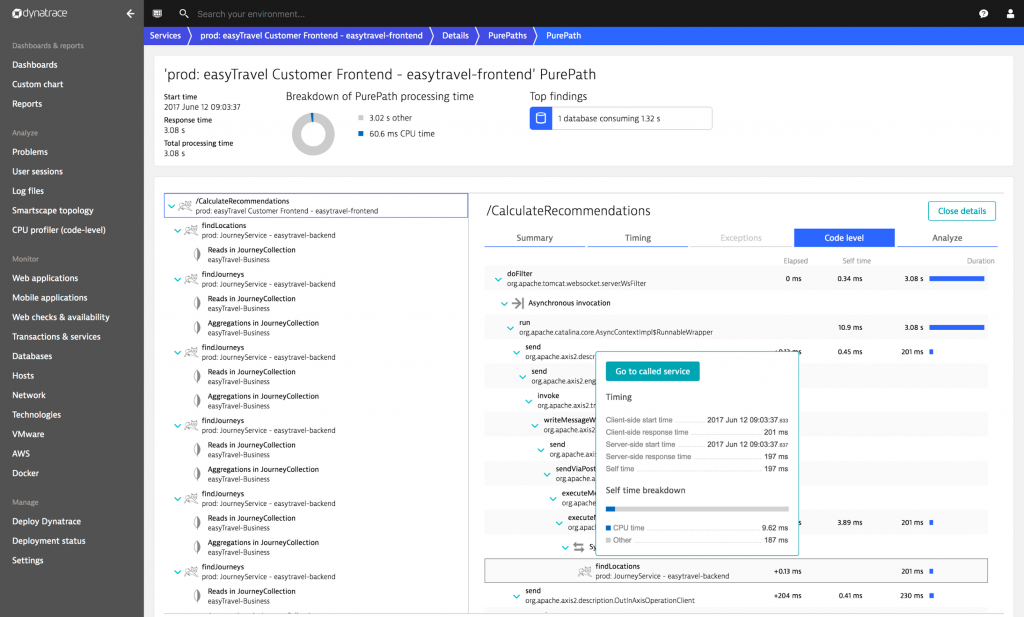
Not only does Dynatrace OneAgent provide metrics for the applications running in Garden containers, it also provides code-level visibility into your distributed application instances.
Deep monitoring provides your microservices teams with the insights required to optimize the performance of services while ensuring complete availability and functionality.

Automatic distributed service tracing
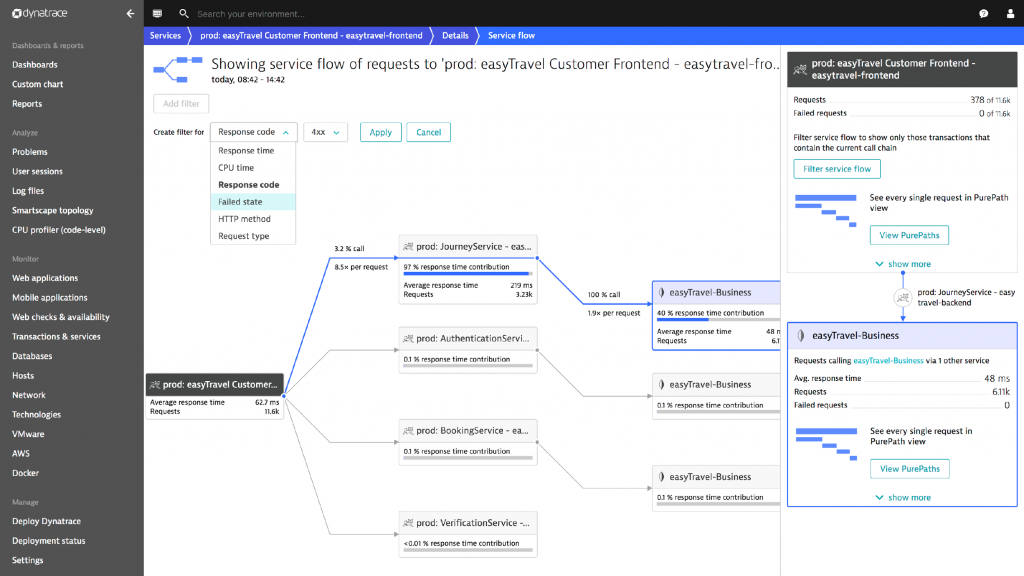
In microservices environments — especially those deployed to Cloud Foundry — automatic distributed service-tracing is a powerful means of continuously and seamlessly tracking the health of the entire microservices architecture.
Service tracing enables tracking of how requests to microservices and Cloud Foundry apps are propagated through a system. Service tracing also helps to identify performance bottlenecks and failed requests in the service-to-service communication chain. It’s never been easier to pinpoint the root cause of poor performance in heterogeneous microservices stacks. Since Dynatrace OneAgent automatically monitors all Cloud Foundry applications on Diego cells, these automated tracing capabilities are automatically applied to your Cloud Foundry applications.

Integrate with your existing BOSH deployments
Dynatrace full-stack monitoring for Cloud Foundry integrates seamlessly with BOSH deployments. Dynatrace provides a BOSH release that you can use as an add-on to deploy OneAgent to your cluster VMs, including Diego Cells and others. The BOSH release also covers deployment of OneAgent to Windows Diego Cells, thereby enabling automatic monitoring of .NET Framework based applications.
For full details on the Dynatrace BOSH add-on, please see How do I deploy OneAgent for full-stack Cloud Foundry monitoring?
We’ve worked with Pivotal to make the Dynatrace Full-Stack Add-on for Pivotal Cloud Foundry available on Pivotal Cloud Foundry. So, if you’re using Pivotal Cloud Foundry, go ahead and download the Dynatrace Full-Stack add-on from the Pivotal Network.


Looking for answers?
Start a new discussion or ask for help in our Q&A forum.
Go to forum