Successful operation and maintenance of large-scale microservices infrastructures can be a big challenge for DevOps teams. You need a powerful full-stack monitoring solution like Dynatrace to gather all relevant performance, error, and availability monitoring data. You also need a reliable control center such as Ansible Tower to react quickly to detected issues and automate self-healing efforts.
Dynatrace provides numerous ways of integrating third-party systems, including Ansible Tower. It’s easy to integrate Dynatrace with Ansible playbooks so you can automatically react to detected problems in real-time with pre-established self-healing strategies.
Integrate Dynatrace with Ansible Tower self-healing
This blog post explains how to set up a simple integration between your Dynatrace full-stack monitoring system and an Ansible Tower playbook. This particular playbook executes self-healing actions on selected machines based on the performance slowdown of a sample web application (easyTravel). As you’ll see, this playbook automatically starts an additional cluster node and restarts existing microservices nodes following a detected application outage.
Ansible Tower setup
A prerequisite for this story is setup of a running Ansible Tower instance that can access your microservices infrastructure. The Ansible Tower installation should have the ability and playbook definitions required to enable your DevOps teams to spin up new microservices instances or to recycle instances once they’re stopped responding.
For the purposes of this demonstration, we quickly set up a new Ansible Tower instance using the following Vagrant commands:
$ vagrant init ansible/tower
$ vagrant up --provider virtualbox
$ vagrant ssh
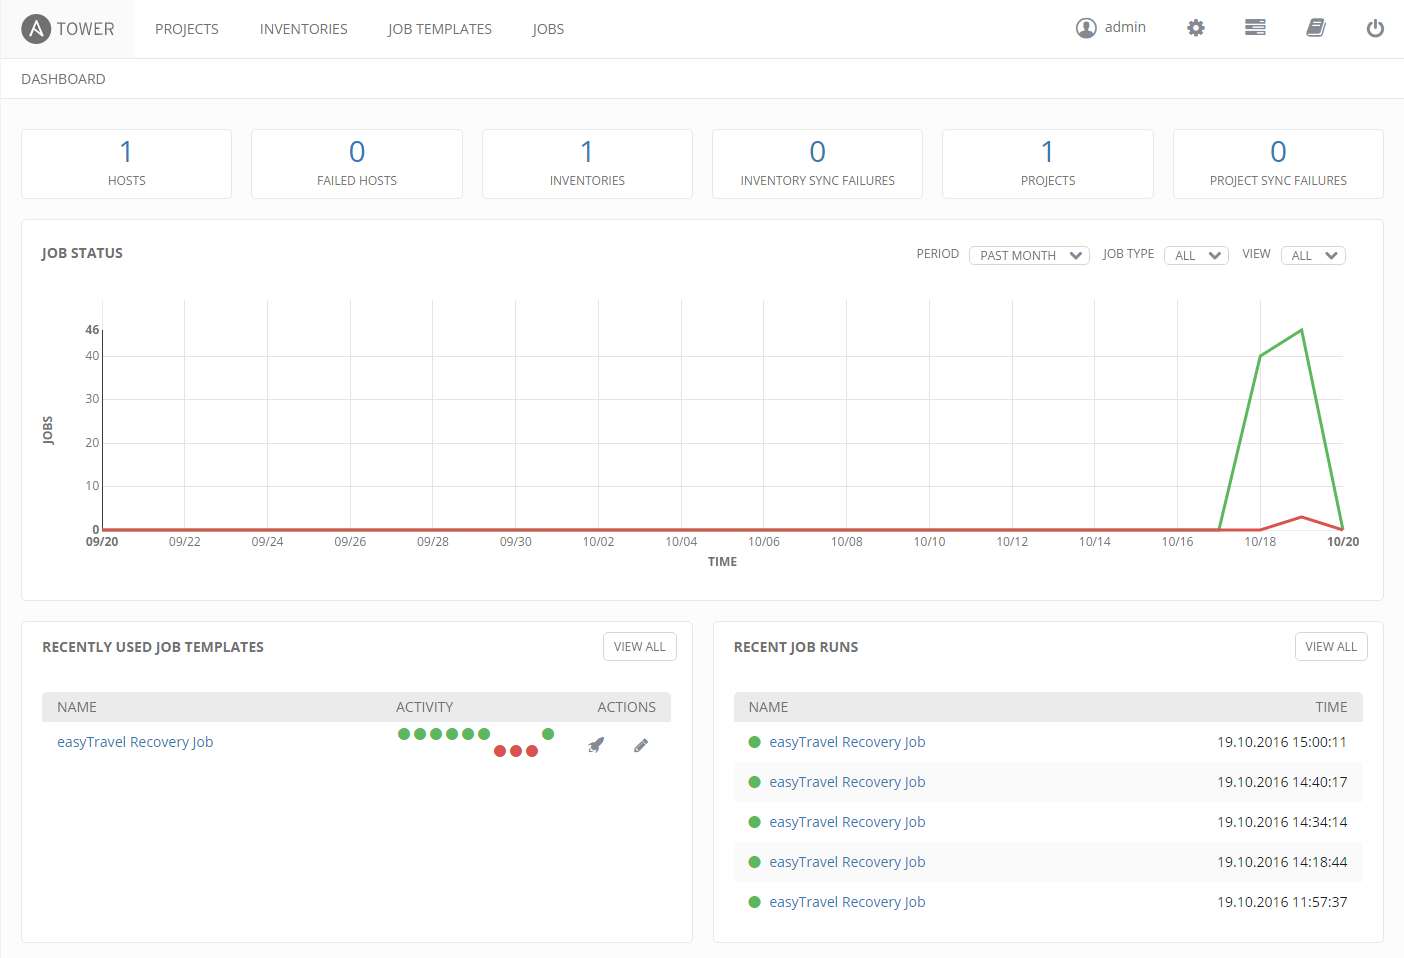
Following Tower startup, we used the Putty key generator to convert the Tower-provided secret key into the Putty SSH authentication key. Once we used the converted key to log into our new Ansible Tower instance, we were able to access the Tower Web interface address and log in. The Ansible Tower Web dashboad is shown below.

Create a playbook
Ansible playbooks contain the commands that you use to control your microservices instances. Playbooks orchestrate the efficient startup of new instances, the killing of unresponsive instances, as well as the configuration of settings on your hosts.
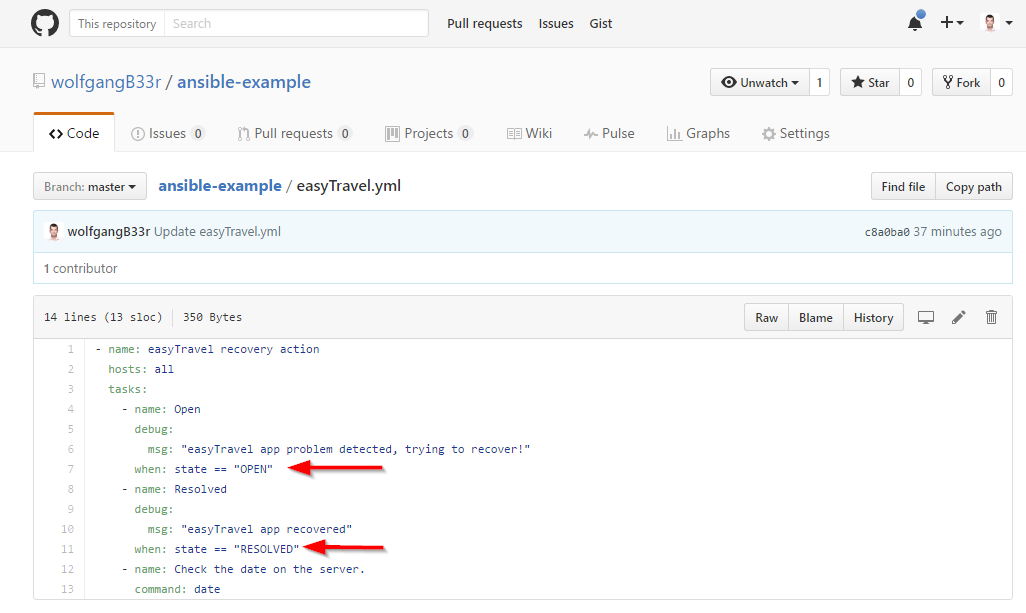
Ansible Tower fetches your playbooks directly from your source code management system (for example, GitHub or Bitbucket). For the purposes of this blog post, we’ve created a sample playbook in our GitHub repository called easyTravel.yml (see below). This playbook executes different tasks depending on the state of problems detected by Dynatrace.

Create your Ansible Tower job template
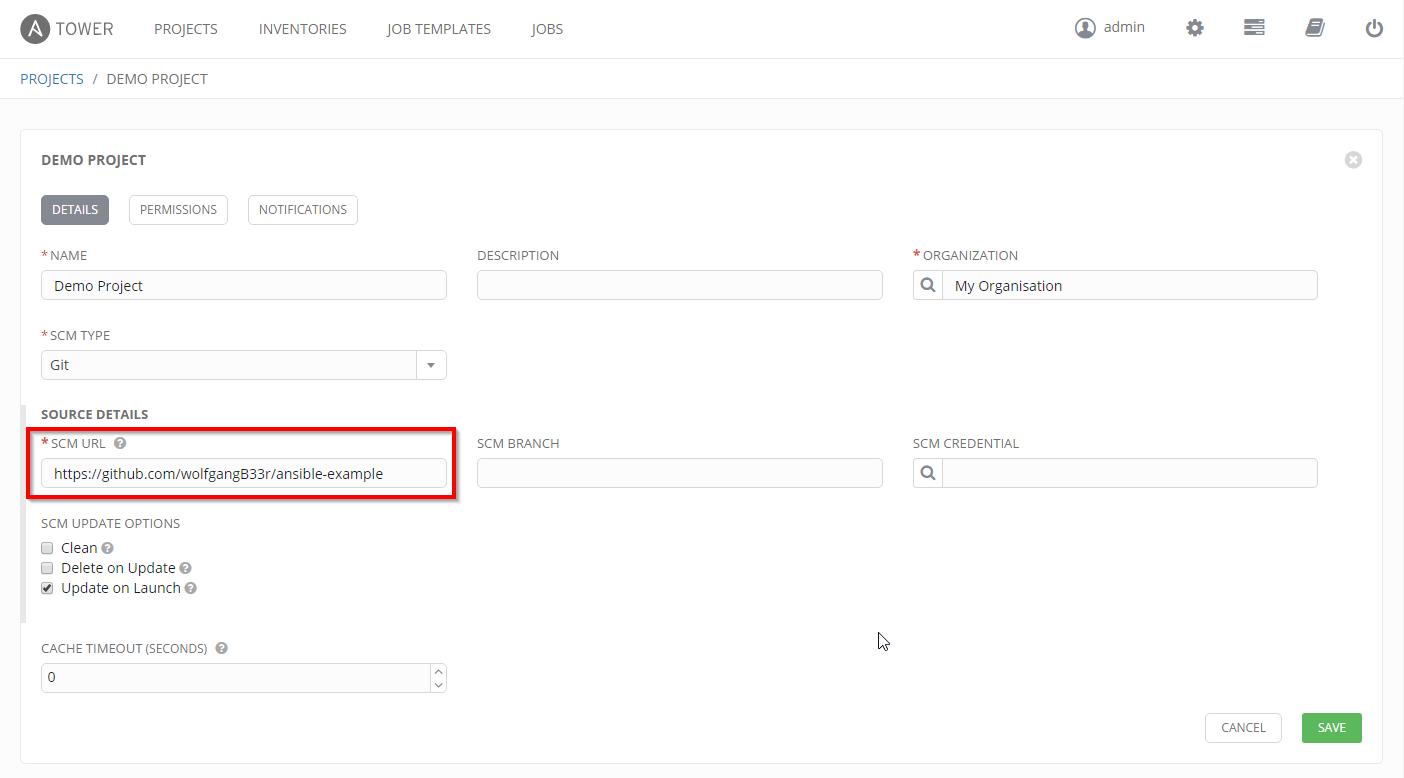
Now that our playbook is available on GitHub, it’s time to create an Ansible Tower Web project that imports the playbook from GitHub, as shown below:

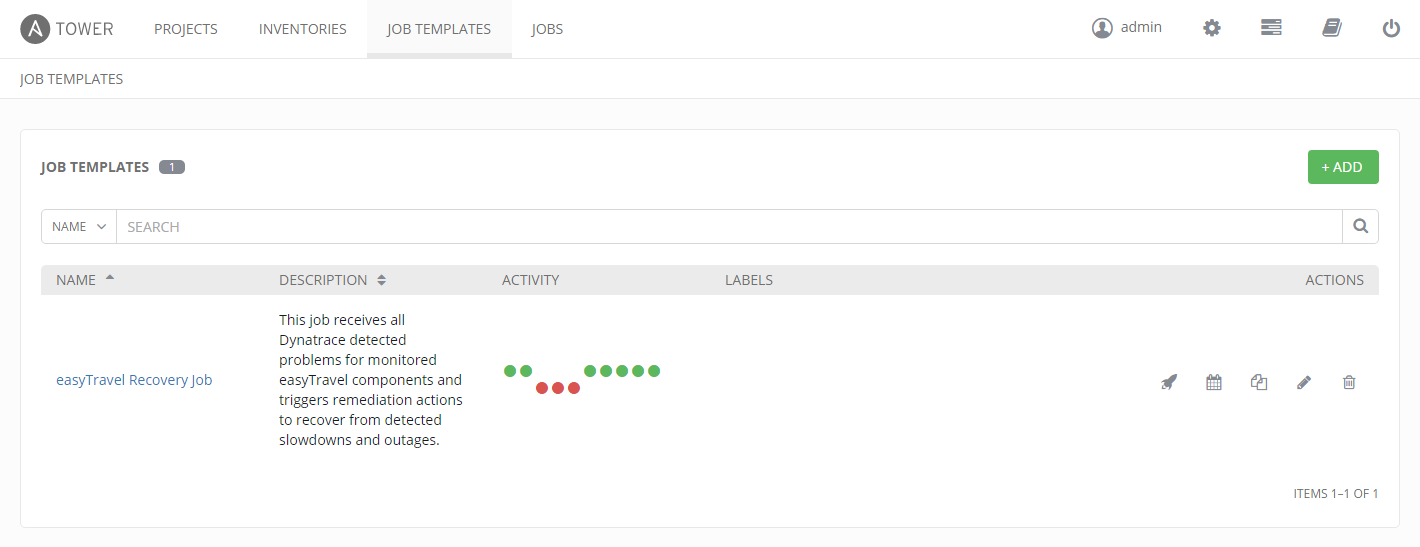
Once the project has been created with the playbook, it’s time to create a new job template that uses the new project.
 Ansible Tower job API
Ansible Tower allows API consumers to automatically fetch a list of existing job templates and receive all the attributes that are assigned to each individual job. Just open a browser and open the following API endpoint to receive a list of available jobs: https:///api/v1/job_templates/

By using a specific job template REST endpoint, it’s easy to set up integration with Dynatrace.
Automatic execution of Ansible jobs for detected problems
To continue with setup
- Open Dynatrace and navigate to Settings > Integration > Problem notifications.
- Click the Set up notifications button.
- On the Edit custom integration page, type a Name for your configuration and paste your Job endpoint URL into the Webhook URL field.
Don’t forget to include the slash at the end of your jobs URL. Otherwise you’ll end up with a HTTP 301 reply! - Type in your Ansible Username and Password.
- Add any required detail regarding detected problems to the Custom JSON payload field of this Ansible job. We’ve included
{State}and{Tags}variables in the example below.

Automatically trigger Ansible Jobs for detected problems
Now that we’ve set up a connection between Dynatrace and Ansible, it’s time to see how a Dynatrace-detected problem triggers a sample remediation action within Ansible Tower.
The Problems list below shows that several problems have been detected in this environment, including a User action duration degradation event related to the easyTravel sample application.

All root-cause analysis, user impact detail, and other information related to this problem are automatically sent to Ansible Tower so that an appropriate remediation action can be executed (shown below).

You can see the corresponding Playbook remediation jobs that have been executed in response to this Dynatrace-detected problem in Ansible Tower.

By clicking a remediation job in the list above, you can view details of the job execution. Note the state of each problem is transmitted to the playbook definition as a variable (for example, state: OPEN) so that Ansible Town can intelligently react to problems based on their state (OPEN, RECOVERED, or CLOSED).
Minimal conditional statements (see below) define which remediation jobs are to be executed for newly detected problems and recovered problems.

Now you’ve seen how easy it is to set up basic Ansible Tower remediation actions that are triggered in real time by problems that are auto-detected by Dynatrace. You can take your Dynatrace Ansible Tower integration much further by adding additional variables. In this way, your DevOps team can define fine-grained remediation actions for each of the applications and services in your environment. You’ll find that by calling remediation jobs directly from your Dynatrace full-stack monitoring system, you can dramatically shorten reaction time for severe outages.


Looking for answers?
Start a new discussion or ask for help in our Q&A forum.
Go to forum