You can now use the global Time frame selector to filter all Hosts monitoring data based on a specific analysis time frame.
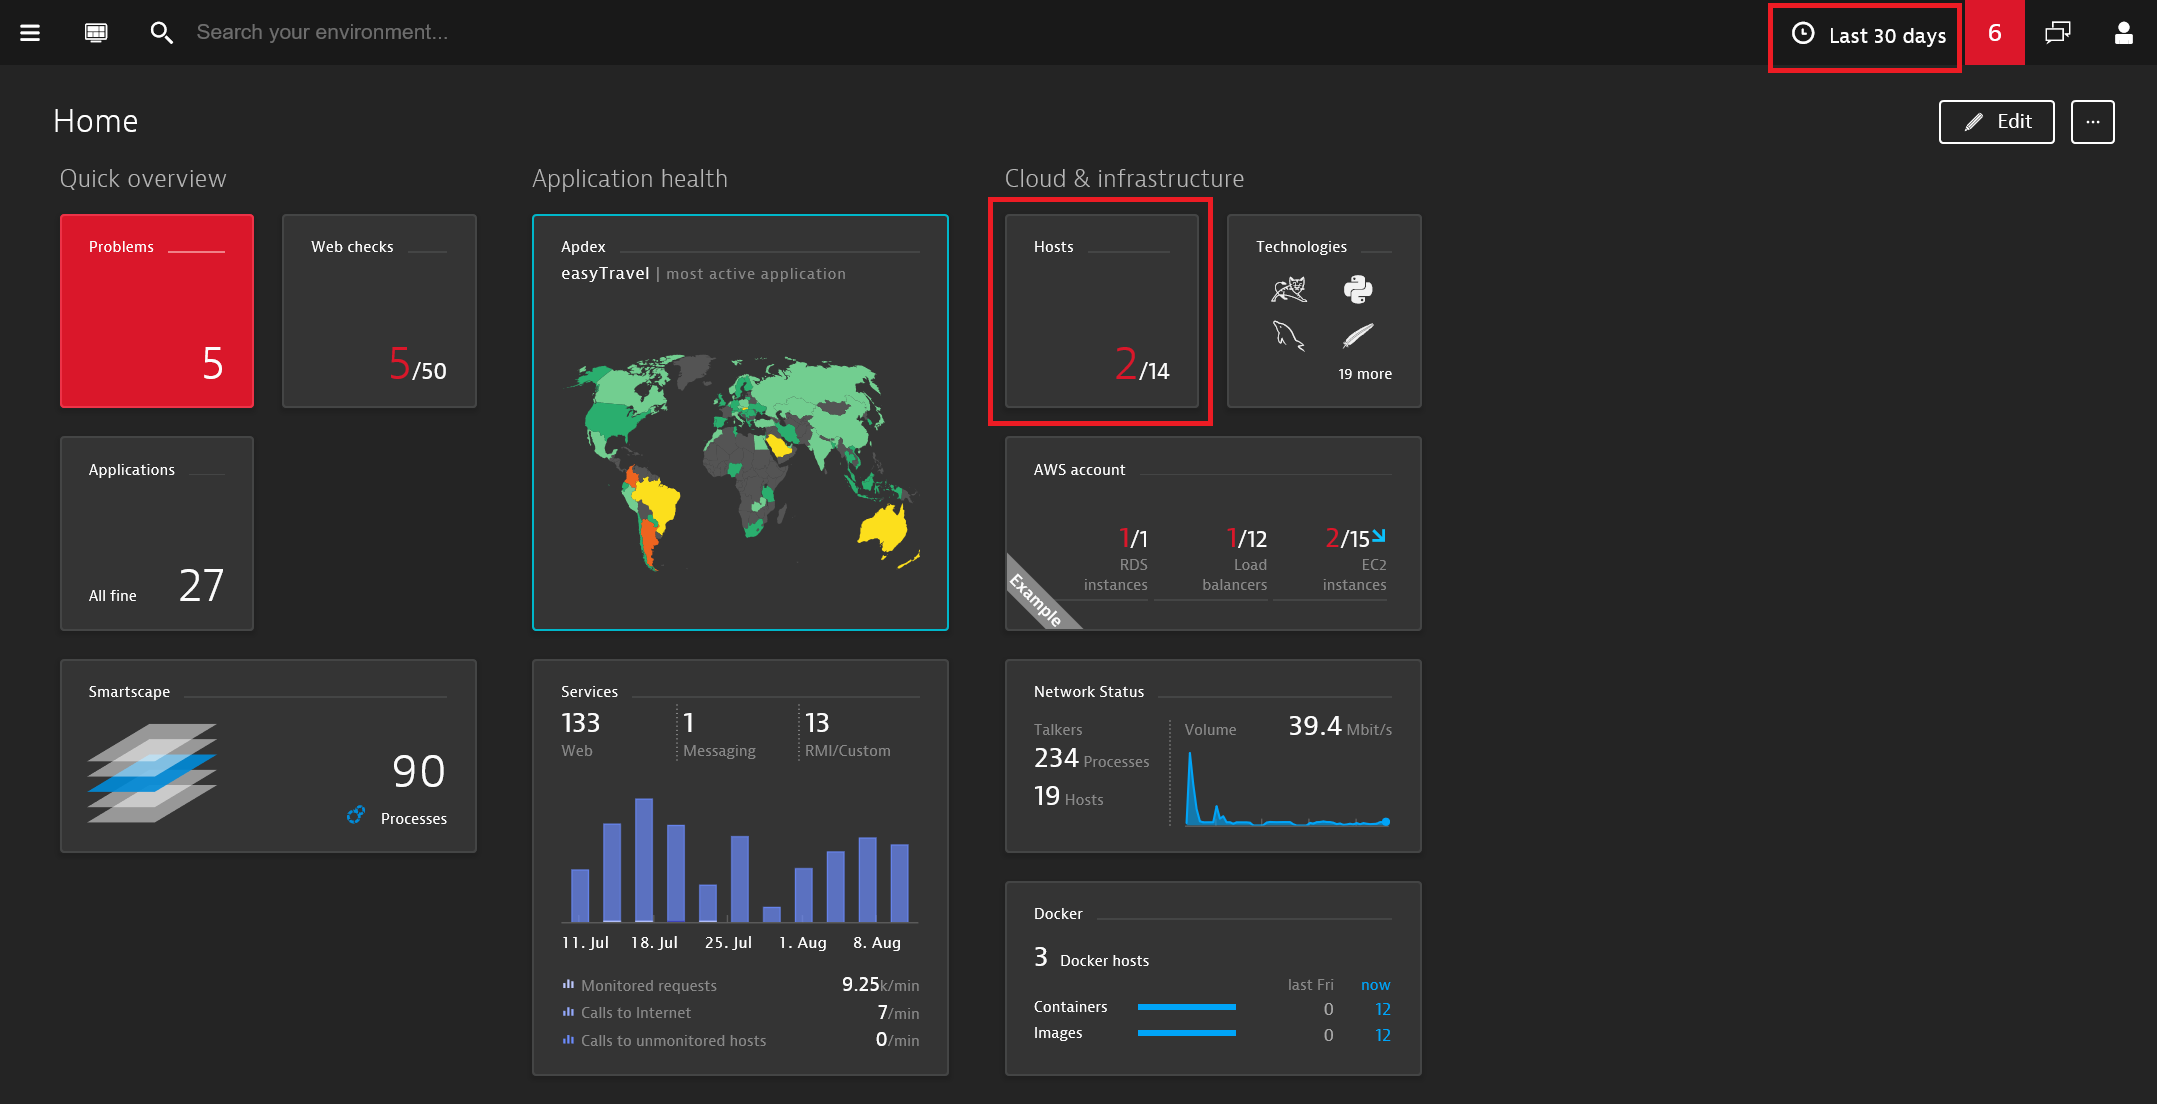
With this new option, you can explore host performance over longer time intervals. This can be particularly handy during troubleshooting or in identifying resource usage patterns. For example, if you select Last 30 days from the Time frame selector (upper-right corner in the image below), the Hosts tile indicates the total number of hosts (14), and the total number of hosts that were either offline or unhealthy (2) during the selected time frame.

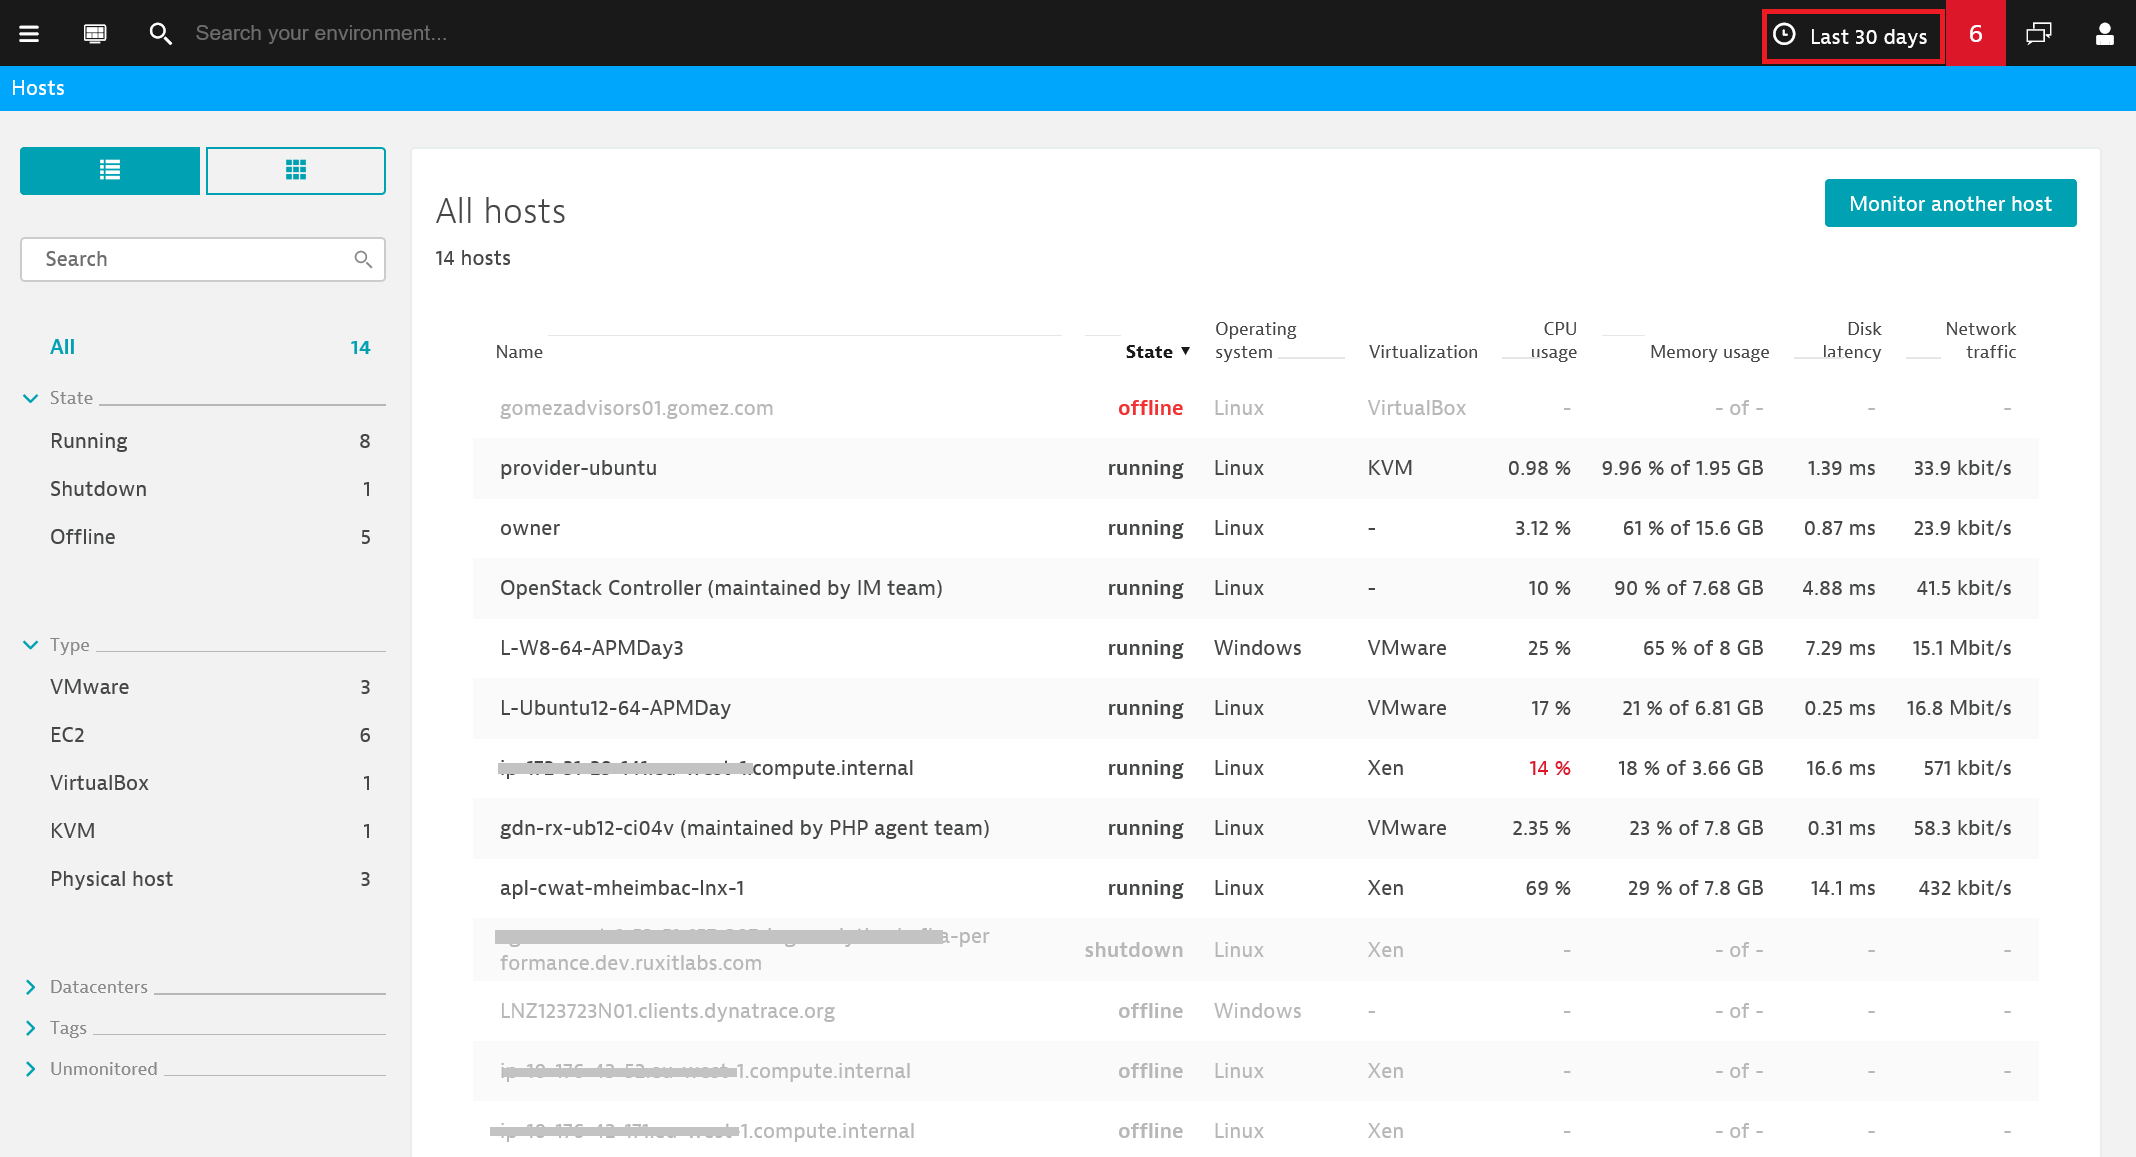
Click the Hosts tile to view the Hosts page, which includes a complete list of all the hosts detected in your environment during the selected time frame. Host State (offline, running, or shutdown) and useful host metrics are displayed here in a sortable view.

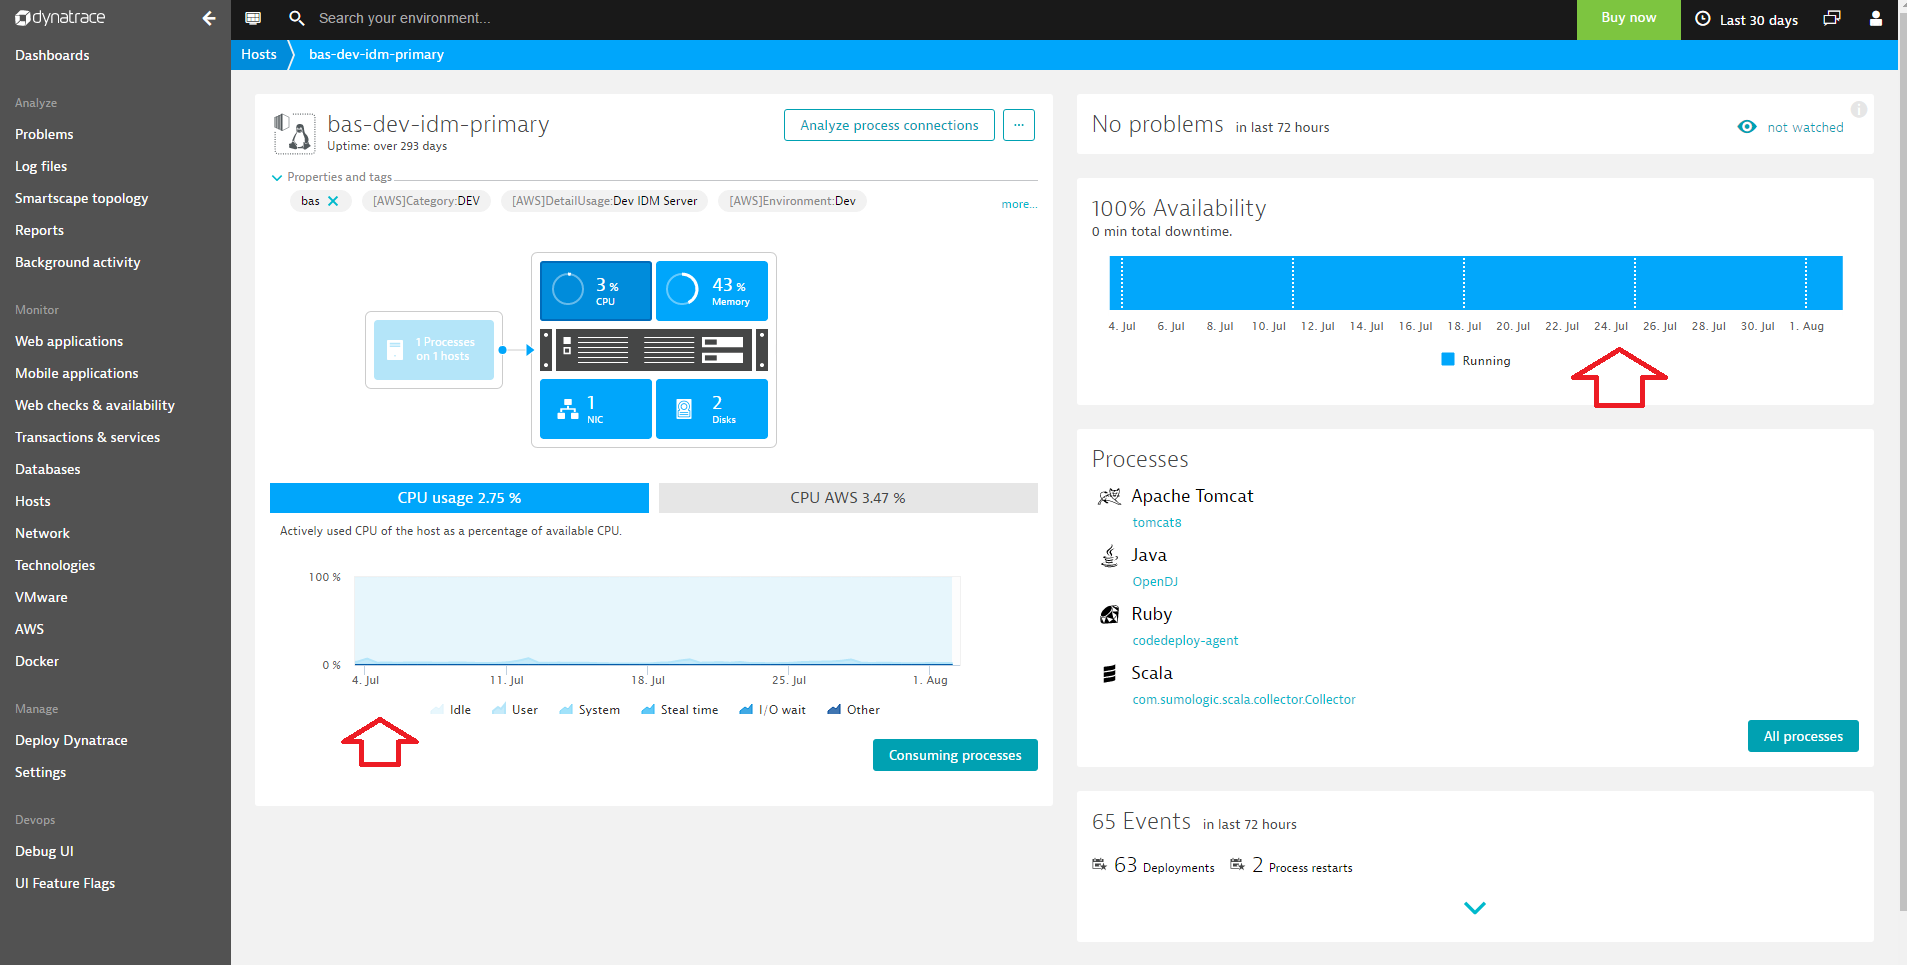
All charts on individual Host pages reflect the time-frame selection, including the Availability chart and the Processes list.
Note that the Problems, Logs, and Events sections don’t reflect selections made using the Time frame selector—they still reflect only the last 72 hours, regardless of the selected time frame. These sections will be enhanced soon to reflect changes made using the Time frame selector, so stay tuned for updates.

Custom time frames
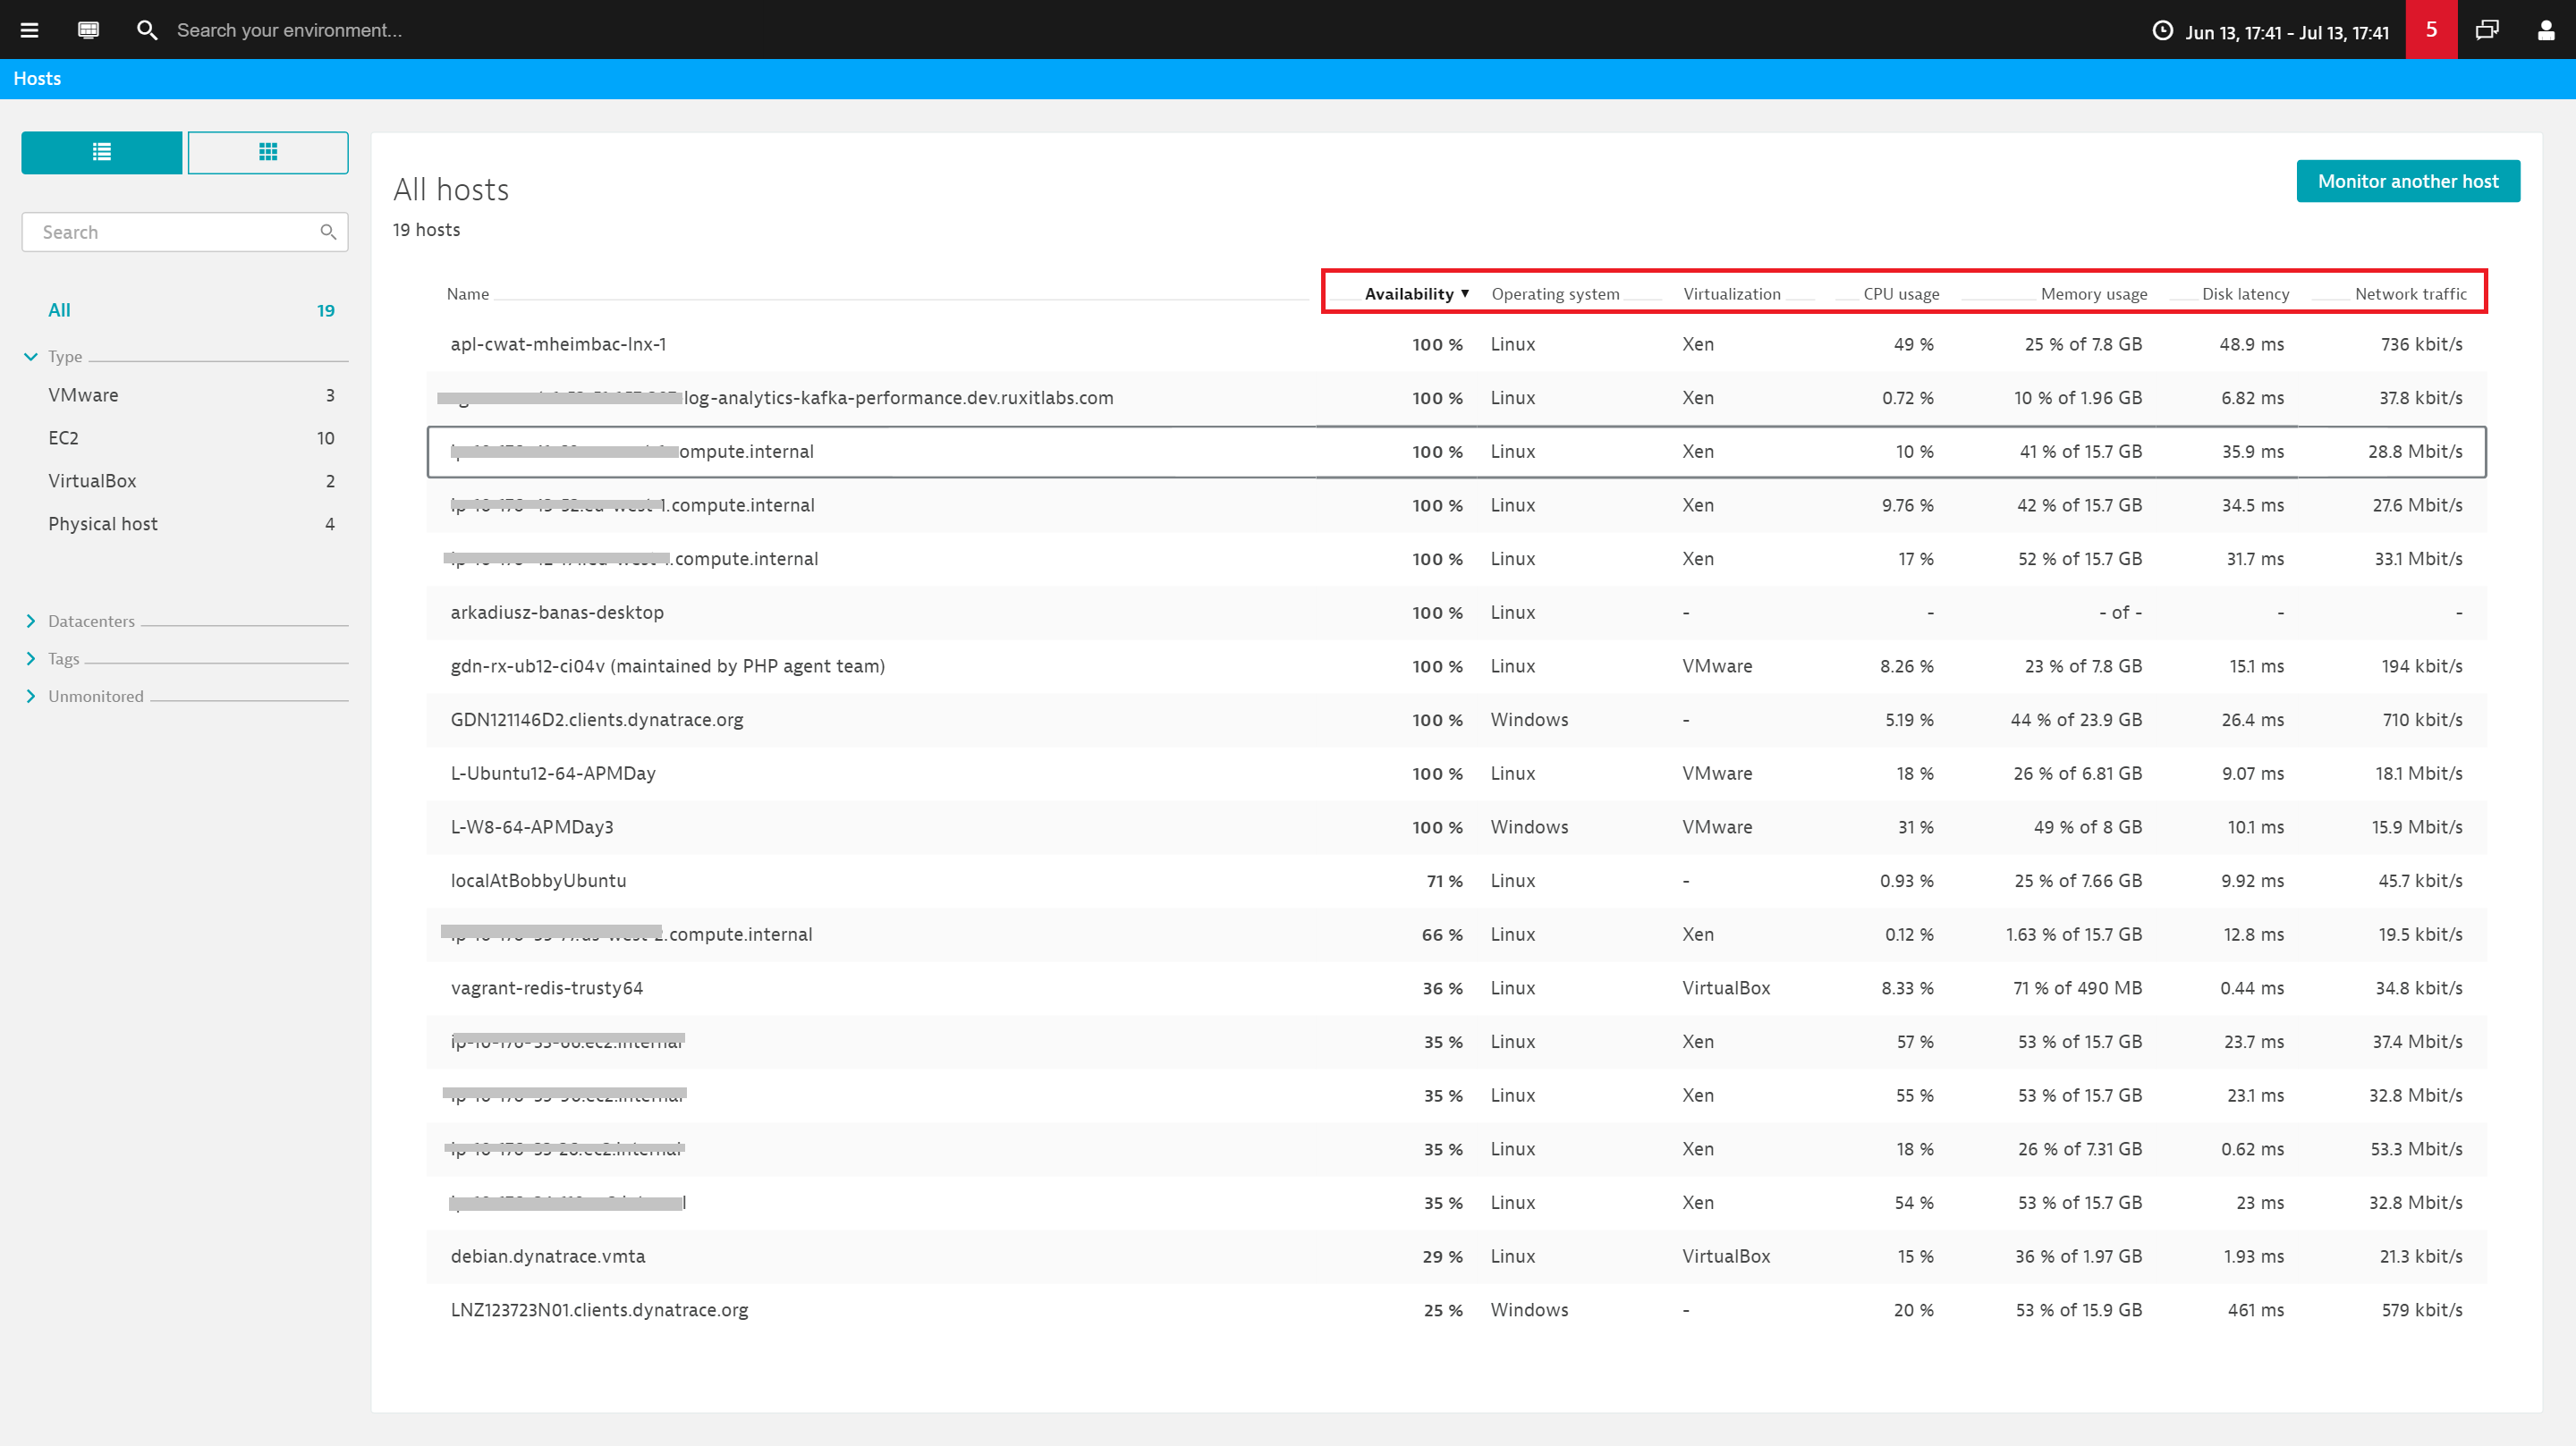
The All hosts page behaves slightly differently when custom time frames are selected using the Time frame selector’s Previous/Next navigation buttons. Rather than showing the most recent values, the values reflect the average values over the selected time frame. Also, State information is replaced with Availability insights (note the Availability column header below).


Looking for answers?
Start a new discussion or ask for help in our Q&A forum.
Go to forum