We’re proud to announce availability of Dynatrace Memcached server monitoring. Dynatrace Memcached server monitoring provides insights into your distributed memory-object caching system so that you can pinpoint server performance issues and identify potential bottlenecks.
Memcached monitoring metrics
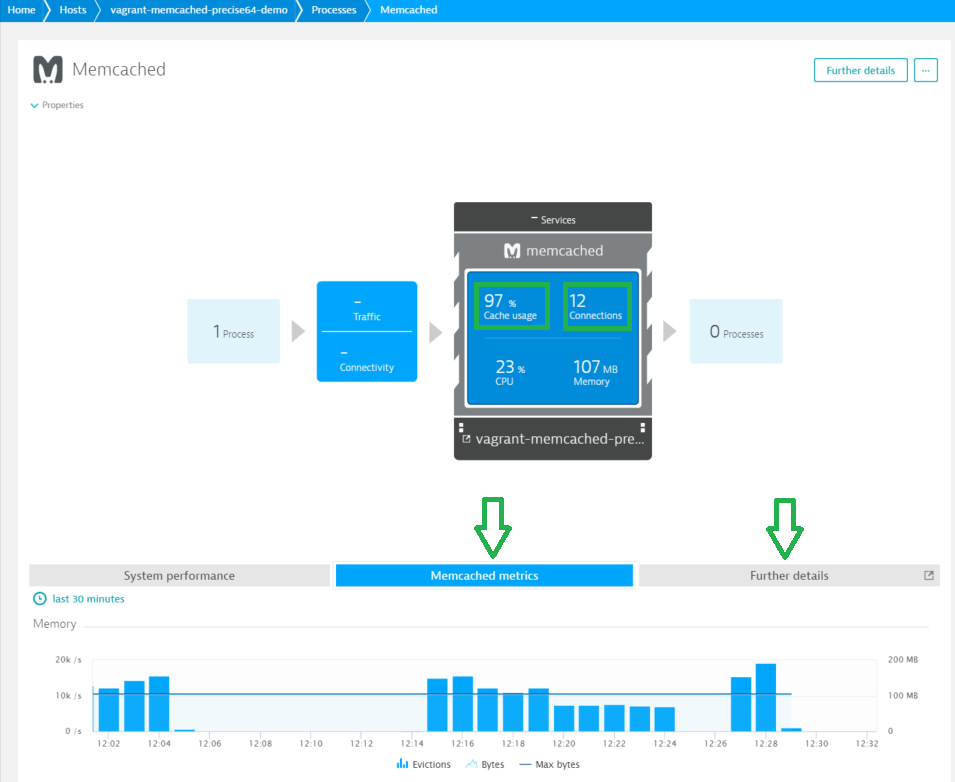
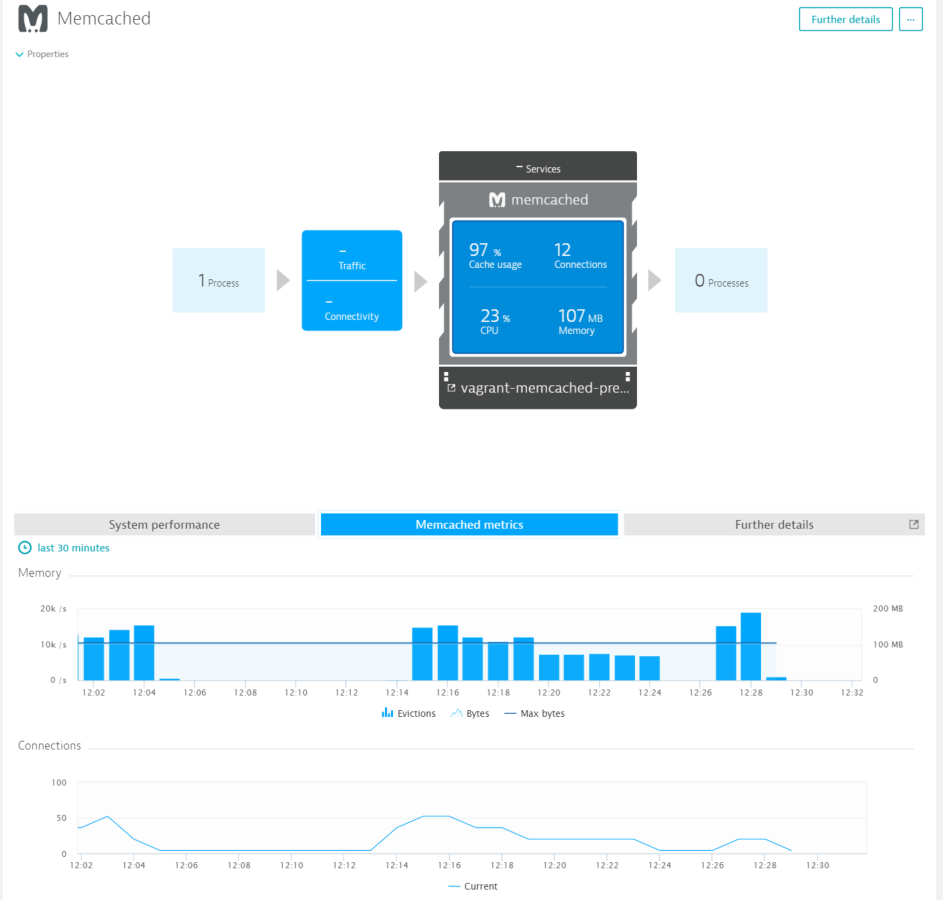
Key Memcached metrics are displayed on each Memcached process page within an intuitive infographic. Click the Memcached metrics and Further details tabs to view deeper insights.

Key metrics
| Cache usage | Percentage of available memory used for Memcached. |
| Connections | Number of open connections. |
Standard metrics
| Evictions | Number of valid items removed from cache to free up memory for new items. Evictions indicate that either:
|
| Bytes | Current number of bytes used to store items. |
| Max bytes | Maximum number of bytes allowed in cache. You can adjust this setting via a config file or the command line while starting your Memcached server. |
| Current | Number of open connections. There should always be available space for new connections. The default max setting for simultaneous connections is 1024. |
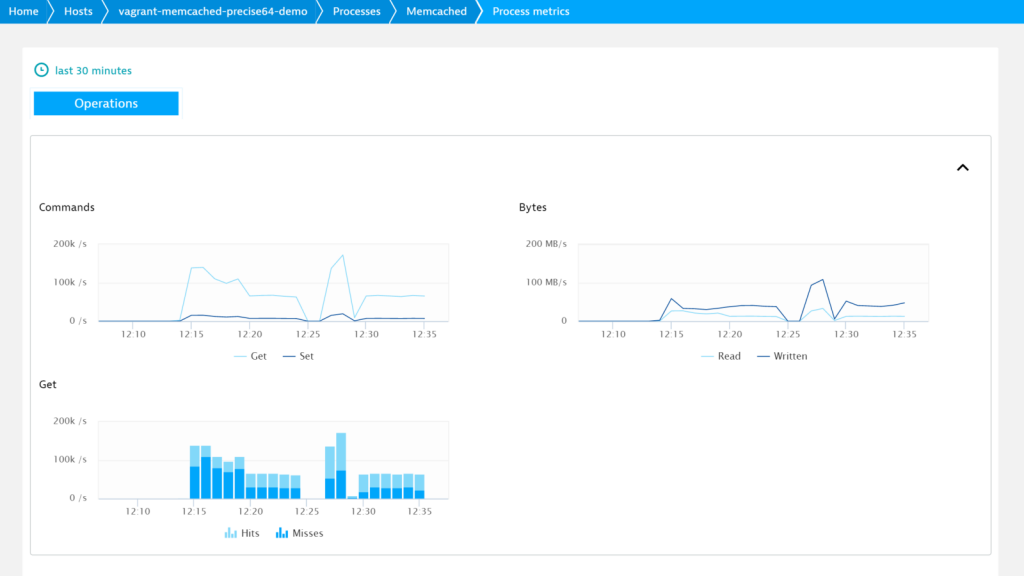
| Get | Number of GET requests received by server per second. |
| Set | Number of SET requests received by server per second. |
| Hits | Number of successful GET requests (items requested and found) per second. The ratio of hits to misses should be as high as possible. Note that this ratio is low following Memcached restart (when the database receives data). |
| Misses | Number of missed GET requests (items requested but not found) per second. These occur when nothing has been cached for a requested key or the cached value of an object is expired. |
| Read | Number of bytes per second sent from the network and read by the server. |
| Written | Number of bytes per second sent by the server to the network. |


Prerequisites:
- OneAgent v1.95 (or higher)
- Memcached Server 1.4.24 (or higher)
- Dynatrace supports TCP UDP and socket connections to Memcached servers. Admin permissions are required for socket connection types 666 or higher.
To enable Memcached monitoring globally:
With Memcached monitoring enabled globally, when a new host running Memcached is detected in your environment Dynatrace automatically collects Memcached metrics.
- Open the Dynatrace menu and select Settings > Monitoring > Monitored technologies.
- Set the Memcached switch to On.
To enable Memcached monitoring for individual hosts:
Dynatrace provides the option of enabling Memcached monitoring for specific hosts rather than globally.
- Disable the global Memcached monitoring setting (if enabled, as explained above).
- Open the Dynatrace menu and select Hosts.
- Select the host you want to configure.
- Click Edit.
- Set the Memcached switch to On.
As this is a beta version, of course your feedback is welcome. Let us know how the new Memcached monitoring plugin works for you. Just add a comment below or post your thoughts to Dynatrace Community.


Looking for answers?
Start a new discussion or ask for help in our Q&A forum.
Go to forum