If you’ve used Dynatrace to analyze the response times of web requests in your environment you may have noticed that some services list a hotspot called Suspension.
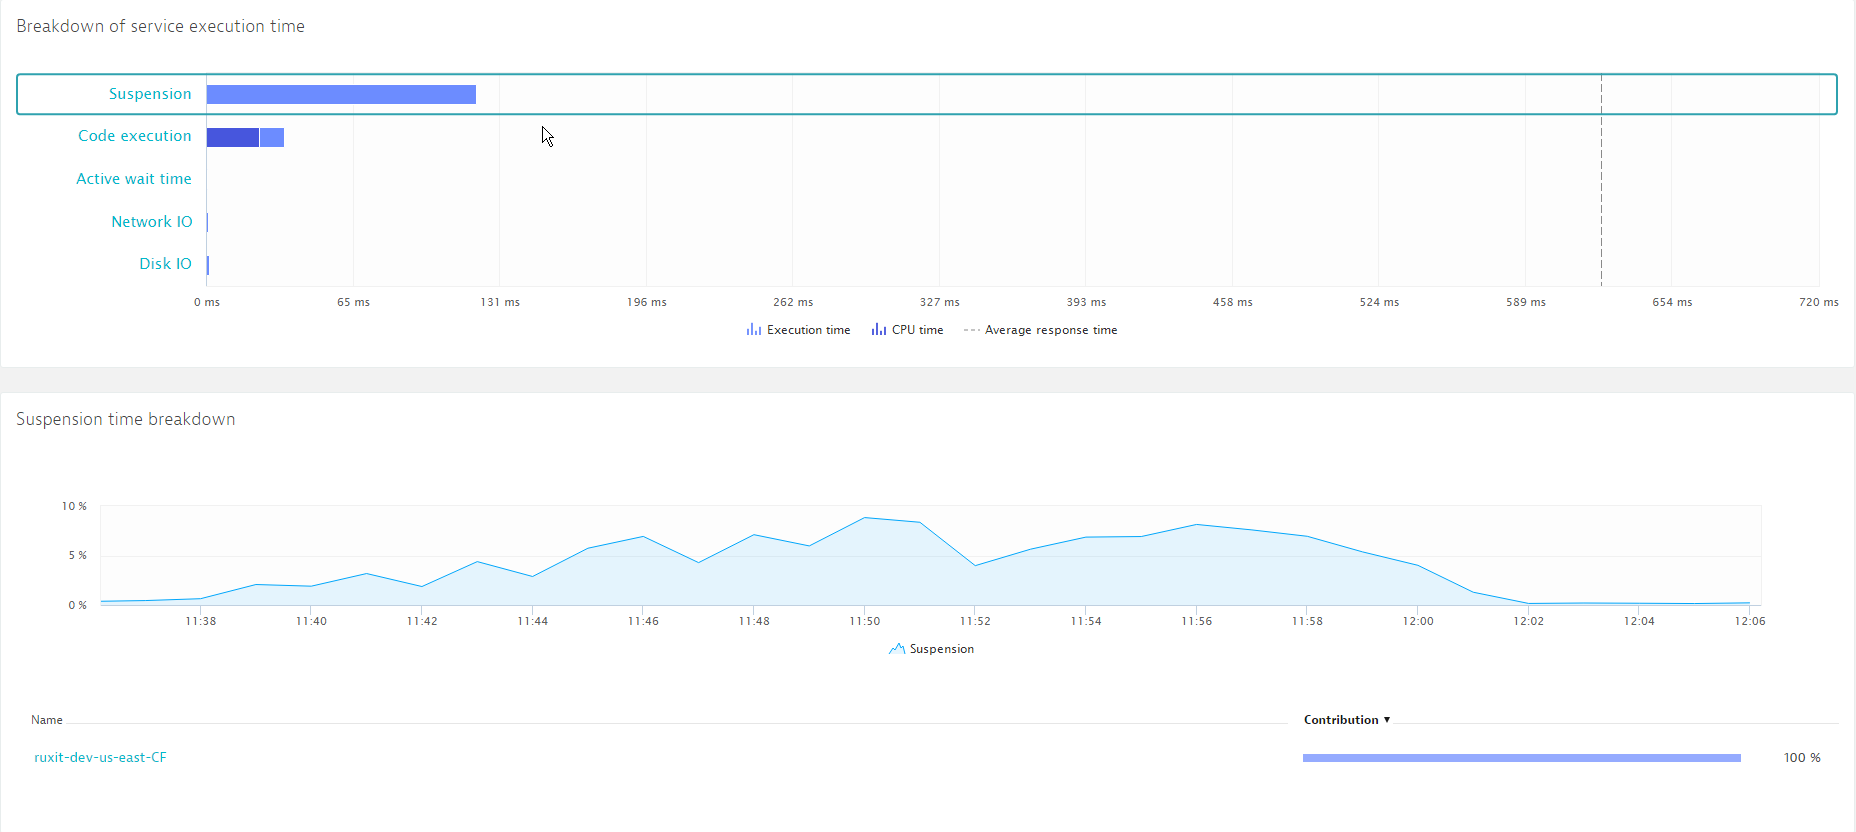
Suspension time represents the amount of time that requests are suspended by the JVM, CLR, or V8 JavaScript engine during garbage collection activities. Dynatrace tracks this and tells you how big an impact suspension has on your requests. To view the impact, click Suspension (see below) on any service Response time analysis page.

The Breakdown of service execution time chart shows how much Suspension time was contributed in context with other metrics like Code execution time. Now you can click the Suspension bar in the breakdown (see below) to view a chart that shows the suspension behavior of the underlying processes over the analyzed time frame.

Further reading
Learn more about Java garbage collection in the eBook Chapter How Garbage Collection Works
Beneath the chart you’ll see all the processes that host instances of the service. In some scenarios there may be just a single process. However if your service is hosted by a cluster, you’ll not only be able to see all processes, you’ll also see if one or more processes contribute more to garbage collection suspension than others. In other words, if a single process in your cluster has a garbage collection problem, even if the other processes are running fine, you’ll easily be able to see the issue based on the size of the Suspension bar. If you detect an outlier process, simply click it to investigate its GC behavior.
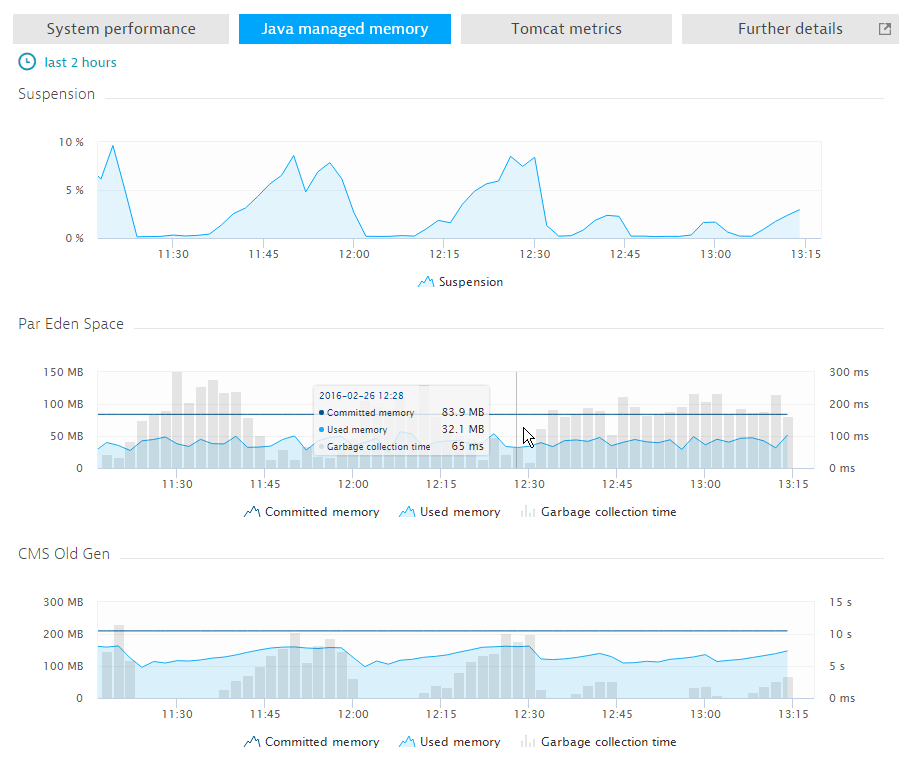
On each Process page you’ll see details about memory and garbage collection trends.

Start a free trial!
Dynatrace is free to use for 15 days! The trial stops automatically, no credit card is required. Just enter your email address, choose your cloud location and install our agent.


Looking for answers?
Start a new discussion or ask for help in our Q&A forum.
Go to forum