A running application is represented through some state stored in memory and calculations carried out by the CPU. Typically performance problems materialize in these two areas. In my last post I’ve explained garbage collection and how to hunt down memory problems in Node.js.
In this blog post, I’ll cover the CPU aspects of Node.js, including the event loop and how to track down tasks that consume too much CPU time and slow down the whole process. Let’s find out what causes very high Node.js CPU usage!
How “single threaded” is Node.js really?
The famous statement ‘Node.js runs in a single thread’ is only partly true. Actually, only your ‘userland’ code runs in one thread. Starting a simple node application and looking at the processes reveals that Node.js, in fact, spins up several threads.

This is because Node.js maintains a thread pool to delegate synchronous tasks to, while Google V8 creates its own threads for tasks like garbage collection.
Finally understanding async I/O & Node.js event loop
Node.js uses libuv which provides the aforementioned thread pool and an event loop to achieve asynchronous I/O. Many articles have been written trying to explain the event loop and still, it took me some time to hopefully really understand what this is all about.
Let’s look at a code sample that may be part of a web application and analyze what happens from a threading standpoint while it gets executed:

The main thread first executes the code and calls the readfile() function.
Reading a file is a synchronous input-output task and can take its time. In synchronous programming, the thread running readfile() would now pause and wait until the system call returns the contents of the file. That’s why for client-server environments (like web applications), most platforms will create one thread per request. A PHP application within Apache using mod_php works precisely like that.
Our “single-threaded” Node.js works differently. To not block the main thread, it delegates the readfile() task to libuv. Libuv will then push the callback function to a queue and use some rules to determine how the task will be executed. It will now use the thread pool to load off work in some cases. Still, it may for instance also employ environment-specific mechanisms that allow creating asynchronous tasks to be handled directly by the operating system.
The event loop continuously runs over the callback queue and will execute a callback if the associated task has been finished. The execution of the callback – and this is critical – will again run on the main thread.
A running Node server can be seen as a cascade of callbacks with the function to run for every incoming request being the root element.
The code example above will work fine and log the file contents to the console. But what if someone decides to perform a CPU consuming operation like calculating some prime numbers inside the callback. This will obviously block the main thread, prevent new requests from being processed, and cause the application to slow down.
Using CPU sampling to trace down CPU-bound operations
To trace down CPU heavy operations we need a way to introspect what’s on the CPU in a given time period. This introspection is called CPU sampling and luckily Google V8, the engine that compiles and executes JavaScript in Node.js, provides a CPU sampling interface that can be accessed from JavaScript using the module v8-profiler.
https://gist.github.com/danielkhan/9cfa77b97bc7ba0a3220
The code above will run the CPU profiler for 5 seconds every 30 seconds and store the sampling data under a timestamp-based filename. Opening such a file reveals a JSON tree structure, and there are several ways to analyze it.
Chrome Developer Tools
Google Chrome ships with a set of developer tools (DevTools) useful for profiling and debugging JavaScript on websites. In my previous post about finding memory leaks in Node I’ve already shown that heap dumps created by v8-profiler can be analyzed in Chrome and the same applies to CPU profiling data.

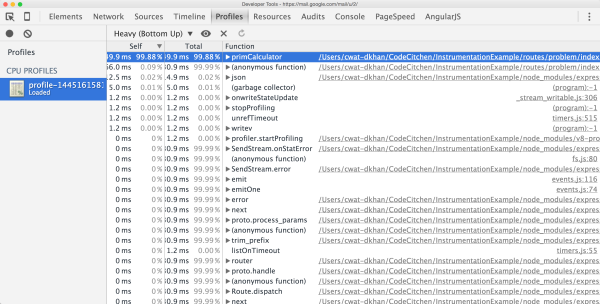
I’ve used an express route for this example that calculates some prime numbers. This is a CPU-intensive task, and by sorting the call tree by ‘heaviness’ – which means how much CPU time is used in the examined period – we can quickly identify the calculation as our culprit. Granted, this is an easy and obvious one, and it’s not always a single function, but some execution path that causes an application to slow down, and sorting by heaviness will only show noise in such cases.
We need an eye-friendly visualization that presents us with the whole call stack to analyze such problems.
A popular solution for that are flame charts and here’s a story by Netflix on how they used flame charts to trace down a bug in their express application.
Using sunburst charts
My personal preference are sunburst charts though and I’ve used them lately to show the huge effect of running express with NODE_ENV set to development versus production. Later I will show how to create them. Now let’s explore what they can tell us.

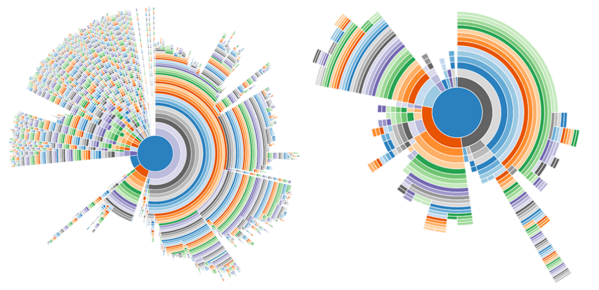
On the left, we see the sunburst chart of a CPU sample taken from an express application running in development mode, and on the right, the same application in production mode.
It becomes instantly clear that much more is going on in development mode.
The blue center is the main function. Every function called directly from main is placed in the adjacent row of the chart. If such a function calls another function, it will be placed into an adjacent segment to the calling function.
One circle segment spans all its children, and the distance from the center is the depth of a function within the call tree. The angle measure represents the time a function and its children spent on the CPU, with 365° being 100% of the time.
Looking at the chart, we see a largely fragmented section on the top left that uses about 25% of the CPU time. How do we know which functions those segments represent?
I’m sure you’ll find out that the aforementioned 25% segment is dedicated to compiling Jade templates. So for every request, the templates are freshly compiled. This makes sense in development mode but in my blog post on this topic I also showed that this is the default when NODE_ENV isn’t explicitly set which can be a problem obviously.
Now that we have used CPU sampling and sunburst charts to trace down a complex CPU-related problem, the only remaining question is how to create such awesome sunburst charts.
Creating sunburst charts with D3.js
D3.js is a popular and very powerful data visualization framework written in JavaScript and amongst many other chart types it supports creating sunbursts.
There are many code examples around and when searching for a starting point a snippet by Martin Etmajer popped up. His way of showing labels would not work for my highly fragmented tree so I adapted the script to use show the function name on hover. Find my full script here.
Wrapping up on CPU analysis & node.js
My previous post on memory monitoring and the current one covering CPU analysis demonstrate that we can get valuable debugging data directly from V8 and that this data can be gathered via JavaScript using v8-profiler. I’ve also shown you how to visualize and analyze this information to trace down problems.
Using these techniques, it is easy to enhance applications with tracing facilities that can even be switched on during runtime to introspect what an application is actually doing.
This can provide a minimum viable monitoring solution for small, single-tier applications.
Node.js and Dynatrace
To see the big picture, including which transactions are passing through your node application, you may want to use Dynatrace. We provide a Node.js agent which will, in conjunction with the various other technologies supported, help you to understand your application as a whole.
This blog post is part of my ongoing research on instrumenting Node.js, and some of the tools introduced here are already in our product or will be incorporated into it soon.
You can start monitoring your Node.JS environment right away with Dynatrace.


Looking for answers?
Start a new discussion or ask for help in our Q&A forum.
Go to forum