Skip to technology filters Skip to main content
Dynatrace Hub

Extend the platform,
empower your team.

Popular searches:
Home hero bg
Mulesoft Cloudhub (Extension v2)Mulesoft Cloudhub (Extension v2)
Mulesoft Cloudhub (Extension v2)

Mulesoft Cloudhub (Extension v2)

Gather metrics and topology from your Anypoint Cloudhub applications

Extension
Free trial
  • Product information
  • Release notes

Overview

Collect Organization, Environment, Application, Endpoint, APIs and Workers metrics for your Mulesoft Cloudhub apps.

Metrics

  • vCores Production - The number of vCores active on the organization for Production environments
  • vCores Sandbox - The number of vCores active on the organization for Sandbox environments
  • vCores Design - The number of vCores active on the organization for Design environments
  • VPCs - The number of VPCs active on the organization
  • VPNs - The number of VPNs active on the organization
  • Gateways - The number of Gateways active on the organization
  • Applications - The number of Applications on the organization
  • Started Applications - The number of Applications that are started on the organization
  • Workers - The number of Workers for an application
  • Remaining Workers - The number of Workers remaining for an application
  • Requests - The number of requests for an application
  • Errors - The number of errors for an application
  • Response Time - The average response time for an application
  • JVM Heap Used - The amount of JVM Heap used for the worker
  • JVM Heap Total - The total amount of JVM Heap for the worker
  • Thread Count - The number of threads for the worker
  • CPU - The CPU usage for the worker
  • Load Average - The load average for the worker
  • Available Processors - The number of available processors for the worker
  • Requests - Per endpoint and response type
  • Response time - Per endpoint and response type
  • Outbound Response Time - Per endpoint and response type
  • Outbound Requests - Per endpoint and response type
  • API Requests - Per API, response_code
  • API Request Size - Per API, response_code
  • API Response Size - Per API, response_code
  • API Response Time - Per API, response_code
  • API Policy Violations - Per API, policy
  • API Requests by Location" - Per API and Location

Get started

Requirements

  • Monitoring needs to be enabled for Cloudhub 1.0 apps, see here

Mulesoft configuration

  • On your Mulesoft account, under Access Management create a Connected App.

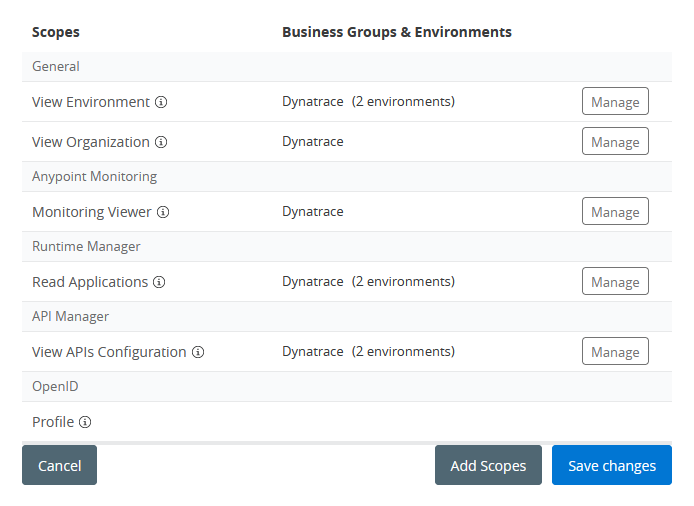
Give the connected app the following scopes:

  • Monitoring Viewer
    • Note, you MUST include the root organization (business unit) on this scope
  • View Organization
  • View Environment
  • Read Applications
  • View APIs Configuration
  • Read Runtime Fabrics

connected_app

Dynatrace configuration

Under Extensions on the left menu, select Mulesoft Cloudhub.

Add a monitoring configuration.

  • Mulesoft Domain URL
    • This is the URL to access your Mulesoft account, for most cases this is https://anypoint.mulesoft.com
    • For Europe, this is https://eu1.anypoint.mulesoft.com
    • For Government Cloud this is https://gov.anypoint.mulesoft.com
  • Mulesoft Client ID
    • From the connected app you created, copy the Client ID
  • Mulesoft Client Secret
    • From the connected app you created, copy the Client Secret
  • Mulesoft Organization/Business Group ID
    • Optional, if empty the default Organization ID will be used
    • You can get a list of all organizations under https://anypoint.mulesoft.com/accounts/businessGroups
  • Frequency
    • How often should we collect data
  • Environments filter
    • Optionally you can filter to only monitor certain environments and applications
    • These filters behave as "contains"
    • You can have multiple filters for a single monitoring configuration
  • Proxy
    • If you need to use a proxy to access the Mulesoft API, you can configure it here

monitoring_config

Details

V2 Apps Support

Starting on version 2.0.0 the extension attempts to collect data from v2 applications.

The following notes apply:

  • The API endpoint used is /amc/application-manager/api/v2/organizations/{org_id}/environments/{environment_id}/deployments/{deployment_id}
  • To keep topology data relevant, some metrics from v1 apps are translated into v2 apps:
    • cloudhub.app.workers - This is obtained from target -> replicas
    • cloudhub.app.remaining_workers - This is the number of replicas

FAQ

Q: What is the DDU Consumption of this extension?

A: The formula for DDU consumption of the extension is:

8 + (7 * <applications>) + (6 * <workers>) + (6 * <apis>) * 525.6 DDUs/year

Example, monitoring 25 applications, with 3 workers per application and 10 APIs gives:

(8 + (7 * 25) + (6 * 75) + (6*10)) * 525.6 DDUs/year = 364,240 (364k) DDUs/year

Q: Does the extension use unsupported Mulesoft APIs?

A: Yes, the extension uses the Mulesoft dashboard APIs which are not public and documented.

Provided by

Dynatrace

Support

By Dynatrace
Dynatrace support center
Subscribe to new releases
Copy to clipboard

Extension content

Content typeNumber of items included
screen layout
5
list screen layout
5
screen entities lists
11
generic relationship
7
screen properties
5
dashboards
1
generic type
5
metric metadata
33
screen chart groups
8

Full version history

To have more information on how to install the downloaded package, please follow the instructions on this page.
ReleaseDate

Full version history

Version 2.2.1

🚀 Features

  • Use the v2 API to gather v1 Apps, which allows the extension to monitor more than 200 v1 applications
  • Added options to disable v1 apps, v2 apps, apis or private spaces data collection

Full version history

Version 2.1.2

  • Add detailed log and log_level option for the fastcheck

Full version history

Version 2.1.1

  • Adds logging for the output of the fastcheck

Full version history

Version 2.1.0

Features

  • Introduce support for Private Spaces VPNs
    • cloudhub.vpn.tunnel.accepted_routes
    • cloudhub.vpn.tunnel.status

No new entities are introduced, metrics can be added to dashboards/data explorer, example:

cloudhub.vpn.tunnel.status:splitBy("org.name", private_space.name, connection.name, vpn.name, vpn.remote_ip_address, vpn.tunnel.local_ptp_ip_address, vpn.tunnel.status):sort(value(auto,descending)):limit(100)

Note, to collect the data, the Connected App needs to have the scope Runtime Manager > Cloudhub Network Viewer

Full version history

Version 2.0.1

  • Fix an issue where v2 applications were not attempted to be collected if we failed to collect v1 applications

Full version history

Version 2.0.0

  • Add initial support for v2 apps

Full version history

Version 1.1.21

  • Fix an issue with actions on Dynatrace 1.271

Full version history

Version 1.1.20

  • Fix an issue where the retry configuration of the http client was incorrect

Full version history

Version 1.1.19

  • Set the primary entity of the extension metrics

Full version history

Version 1.1.18

  • Change display names for the Environment and Organization entity types
  • Adjust cards so empty charts are not shown

Full version history

Version 1.1.17

  • Enable injections for the Organization and Environment screens

Full version history

Version 1.1.14

  • Remove retries when HTTP status codes are < 429

This fixes an issue where too many requests were being made under some conditions

Full version history

Version 1.1.13

  • Fix an incompatibility issue with Windows Activegates

Full version history

Version 1.1.12

  • Add new metrics for outgoing operations
  • Reduce verbosity of logs

Full version history

Version 1.1.11

  • Remove a filter on endpoints being HTTP

Full version history

Version 1.1.10

  • Fix an issue when reporting a large number of metrics at once.

Full version history

Version 1.1.9

  • Fix a typo in the Europe endpoint URL

Full version history

Version 1.1.8

  • Fixes an issue where child organizations don't report gateway utilization
  • Logs are a clearer when an organization fails to report data

Full version history

Version 1.1.7

Reduce the timeout of the fastcheck so more meaningful messages are returned

Full version history

No release notes

Dynatrace Hub
Hub HomeGet data into DynatraceBuild your own app
Log Management and AnalyticsKubernetesAI and LLM ObservabilityInfrastructure ObservabilitySoftware DeliveryApplication ObservabilityApplication SecurityDigital ExperienceBusiness Analytics
Filter
Type
Built and maintained by
Deployment model
SaaS
  • SaaS
  • Managed
Partner FinderBecome a partnerDynatrace Developer

All

3 Results filtered by:

Zabbix Integration logo

Zabbix Integration

Eliminate event storms using Zabbix hosts data and problems in Dynatrace

Jira Integration logo

Jira Integration

Integrate Dynatrace metrics and problem analysis into automated Jira workflows.

Nagios Integration logo

Nagios Integration

Eliminate event storms, using Nagios hosts data and problems in Dynatrace

Reach out to certified Dynatrace partners to solve your unique use-case

Spica Solutions logo

Spica Solutions

Certified individuals: 30Endorsements: Services Endorsed Partner
Authorized Sales Partner
Moviri logo

Moviri

Certified individuals: 14
Advanced Sales Partner
Alanata logo

Alanata

Certified individuals: 30Endorsements: Services Endorsed Partner
Premier Sales Partner
AskMe Solutions & Consultants Co Ltd logo

AskMe Solutions & Consultants Co Ltd

Certified individuals: 30Endorsements: Services Endorsed Partner
Authorized Sales Partner
Matrix logo

Matrix

Certified individuals: 14
Premier Sales Partner
Spindox logo

Spindox

Certified individuals: 11
Authorized Sales Partner
Omnilogy logo

Omnilogy

Certified individuals: 38Endorsements: Services Endorsed Partner
Premier Sales Partner
avodaq AG logo

avodaq AG

Certified individuals: 31Endorsements: Services Endorsed Partner
Advanced Sales Partner
Eviden logo

Eviden

Certified individuals: 79Endorsements: Services Endorsed Partner
Premier Sales Partner
Phenisys logo

Phenisys

Certified individuals: 32Endorsements: Services Endorsed Partner
Premier Sales Partner