Dynatrace tracks all requests from end-to-end and automatically monitors the services that underly each transaction. The performance and attributes of each request can be analyzed in detail. You can even create custom, multi-faceted filters that enable you to analyze call sequences from multiple angles. With such advanced request filtering, Dynatrace enables you to slice and dice your way through your requests to find the proverbial “needle in a haystack.” Until now such filtering was only possible on certain predefined attributes. With the latest Dynatrace release, you can now configure custom request attributes that you can use to improve filtering and analysis of problematic web requests.
What are request attributes?
Request attributes are essentially key/value pairs that are associated with a particular service request. For example, if you have a travel website that tracks the destinations of each of your customers’ bookings, you can set up a destination attribute for each service request. The specific value of the destination attribute of each request is populated for you automatically on all calls that include a destination attribute (see the easyTravel destination attribute example below).
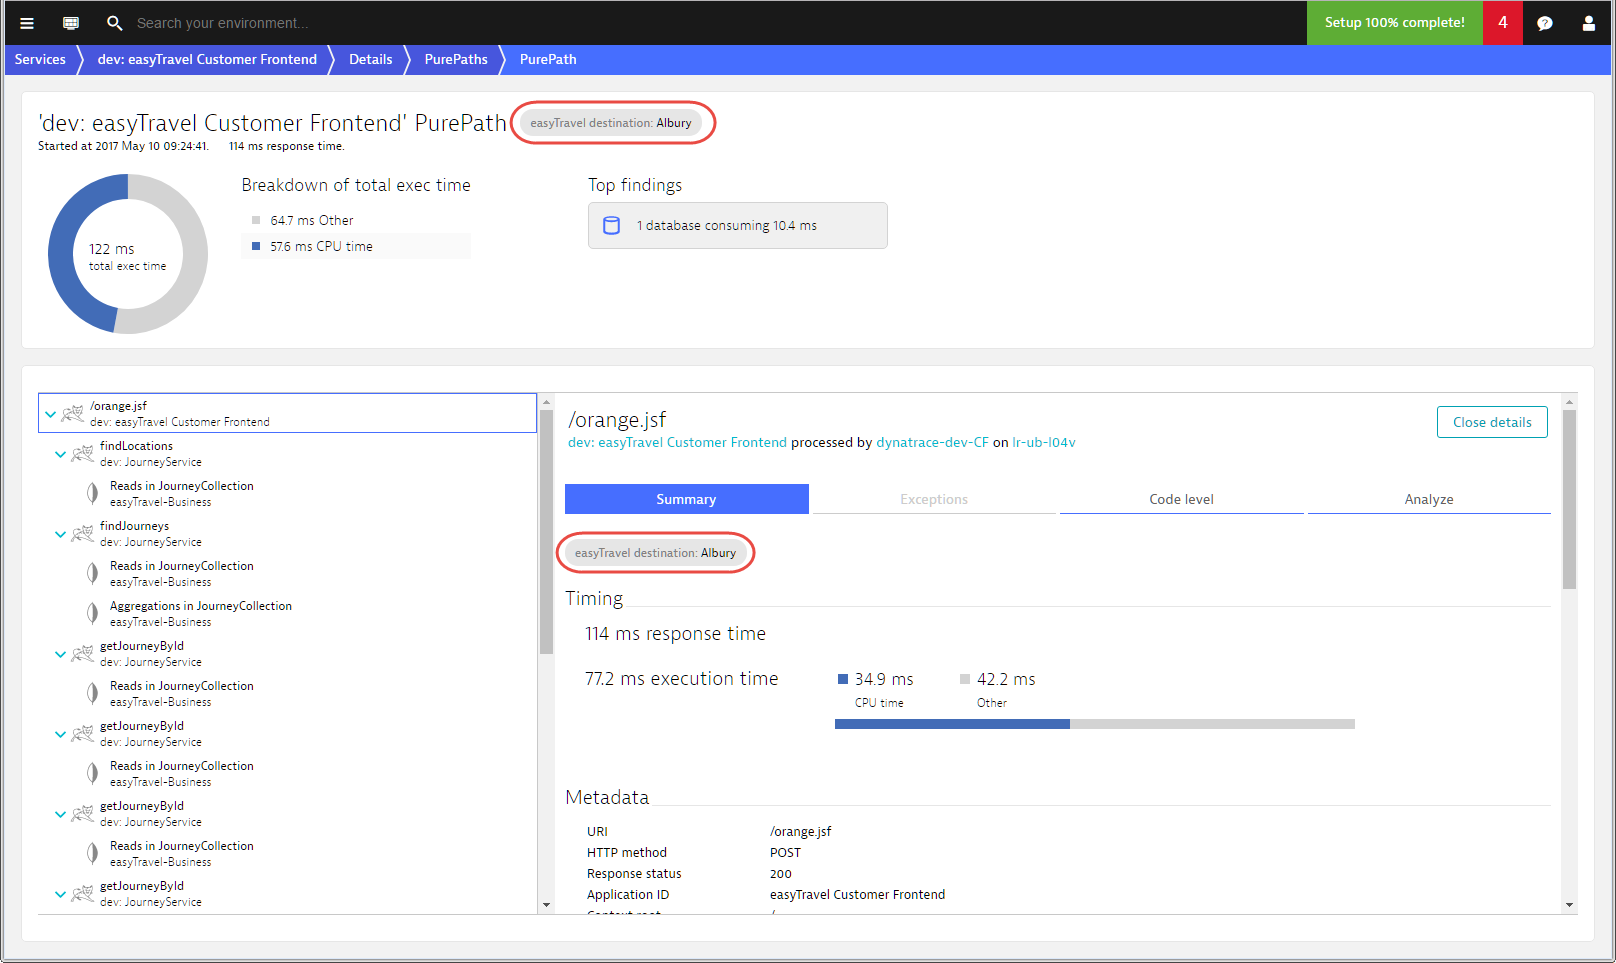
If an attribute exists on multiple requests within a single PurePath then the attribute is applied to each request. In such instances, a single attribute may have varying values for each transaction request in the PurePath. You can even have multiple attributes on the service calls within a single PurePath. This makes request attributes a powerful and versatile feature when combined with Dynatrace advanced filtering.
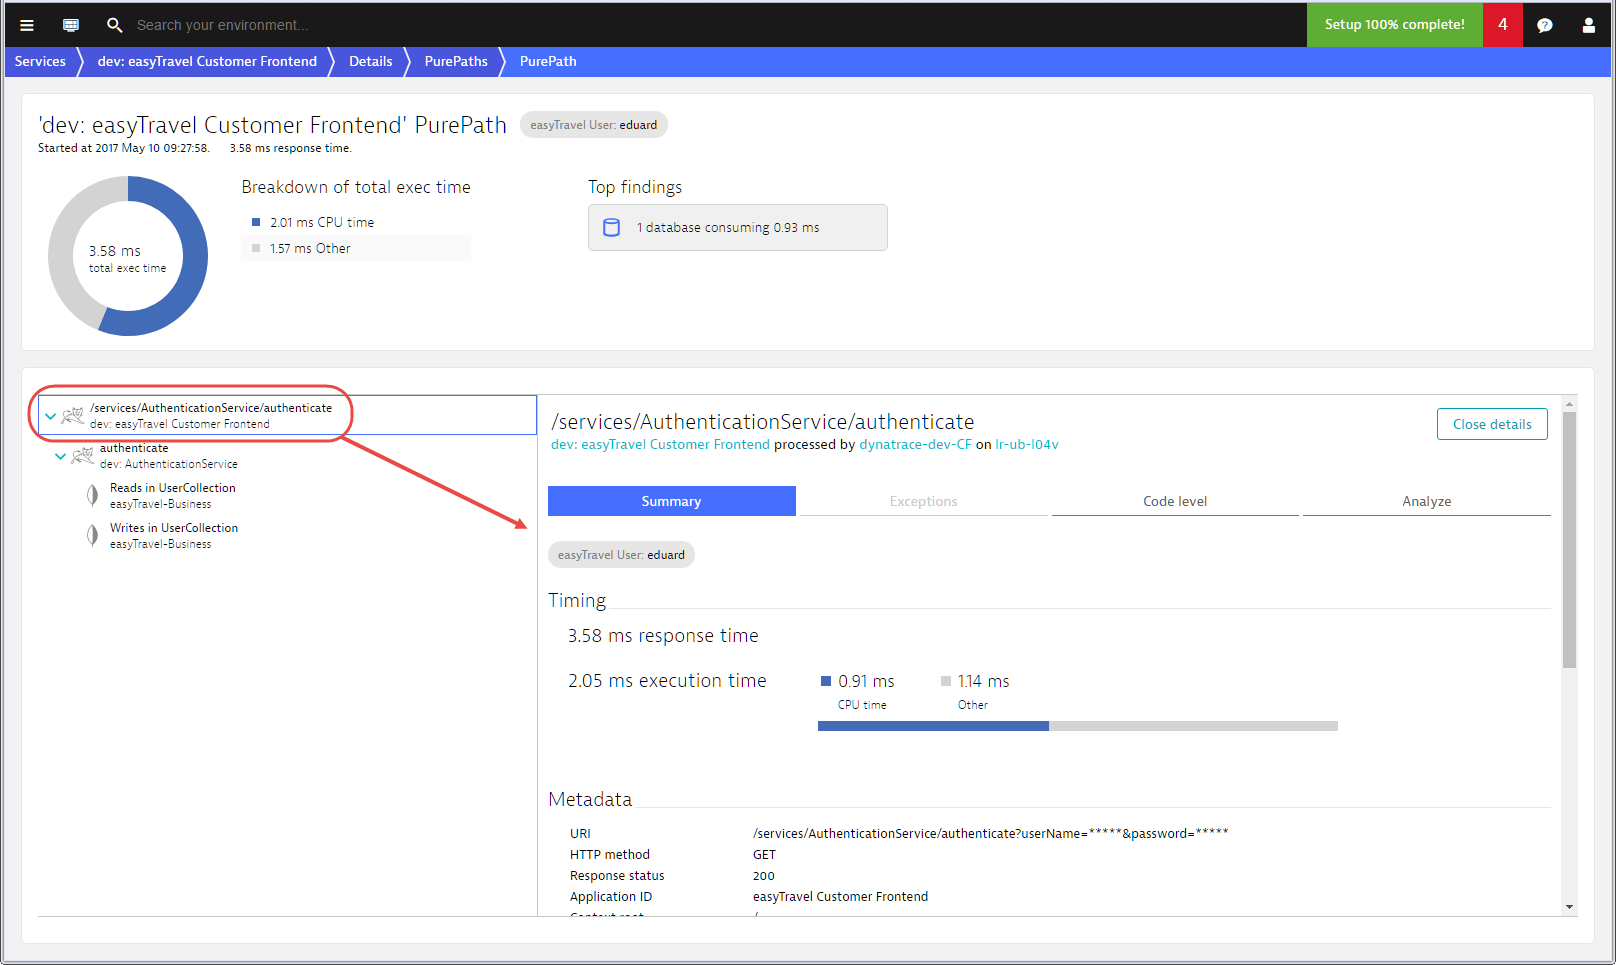
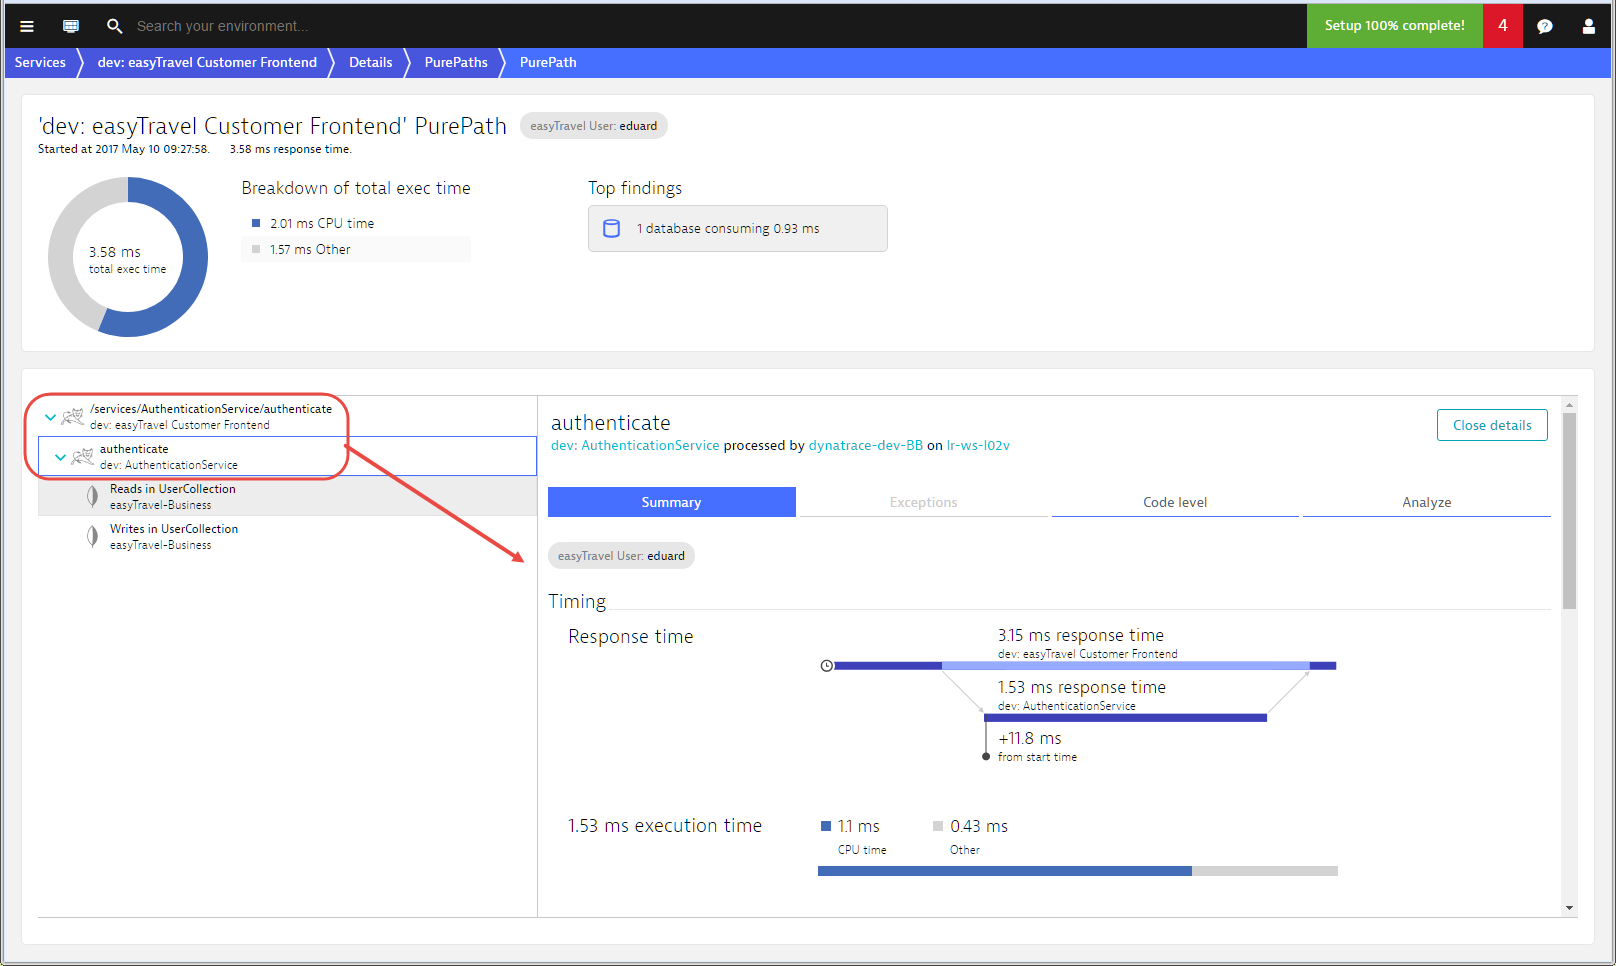
In the image below you can see that the easyTravel User attribute exists on the triggering request (/services/AuthenticationService/authenticate) as well as on the authenticate request of the AuthenticationService that is being called. In the same below the value is the same, however your application might be different and the values might not agree.
Create a request attribute
To configure a request attribute
- Go to Settings > Server-side monitoring > Request attributes.
- Click the Create new request attribute button.
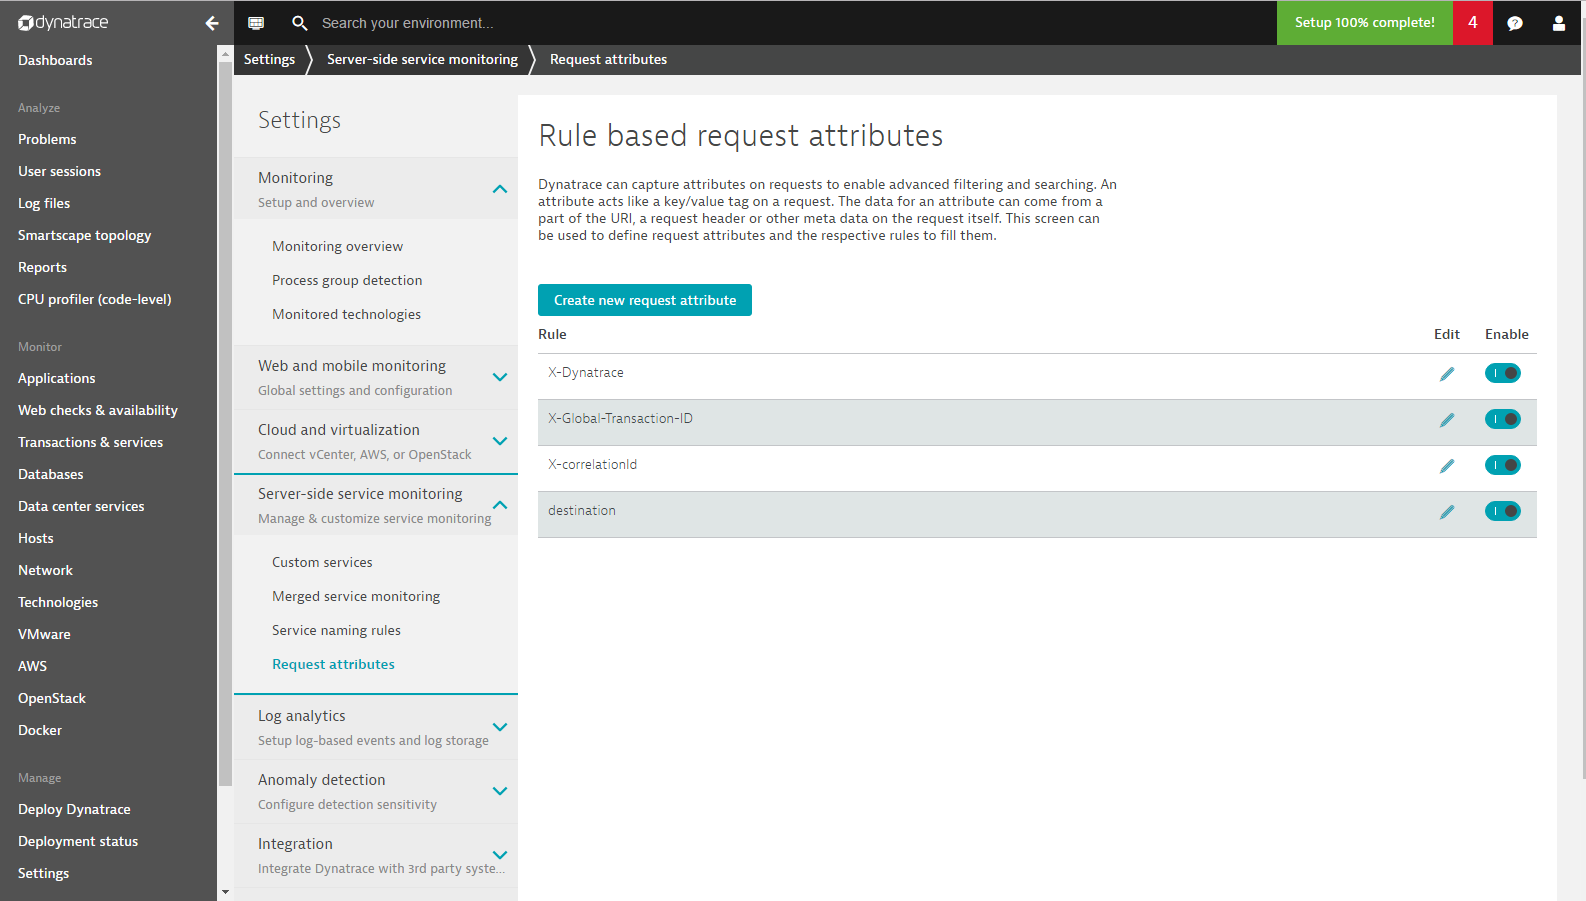
- Provide a unique Request attribute name. You can rename an attribute at any point in the future.
- Request attributes can have one or more rules. Rules define how attribute values are fetched.
Request attribute rules
Have a look at the example request attribute rule below. Note that the request attribute destination can obtain its value from two different sources, either an HTTP Post parameter (iceform:destination) or an HTTP GET parameter (destination). Rules are executed in order. If a request meets the criteria for both rules, its value will be taken from the first rule.
Each rule needs a source. In the example below, the request attribute source is a web request HTTP GET parameter (destination).

This GET parameter will be captured on each and all monitored processes that support code-level insight and it will be reported on all requests that are monitored by Dynatrace.
While this is convenient, it’s not always what’s needed. This is why you can restrict rules to a subset of process groups and services. To do this, select process group and service names from the four drop-lists above to reduce the number of process groups and services that the rule applies to.
You may not be interested in capturing every value. In other cases, a value may contain a prefix that you want to check against. To do this, specify that the designated parameter should only be used if its value matches a certain value. You can also opt to not to use an entire value, but instead extract a portion of a value. The example below is set up to only consider iceform:destination HTTP POST parameters that begin with the string Journey :. This approach will extract everything that follows the string Journey: and store it in the request attribute.

Requests can have as many attributes as you want.
Request attributes on service pages
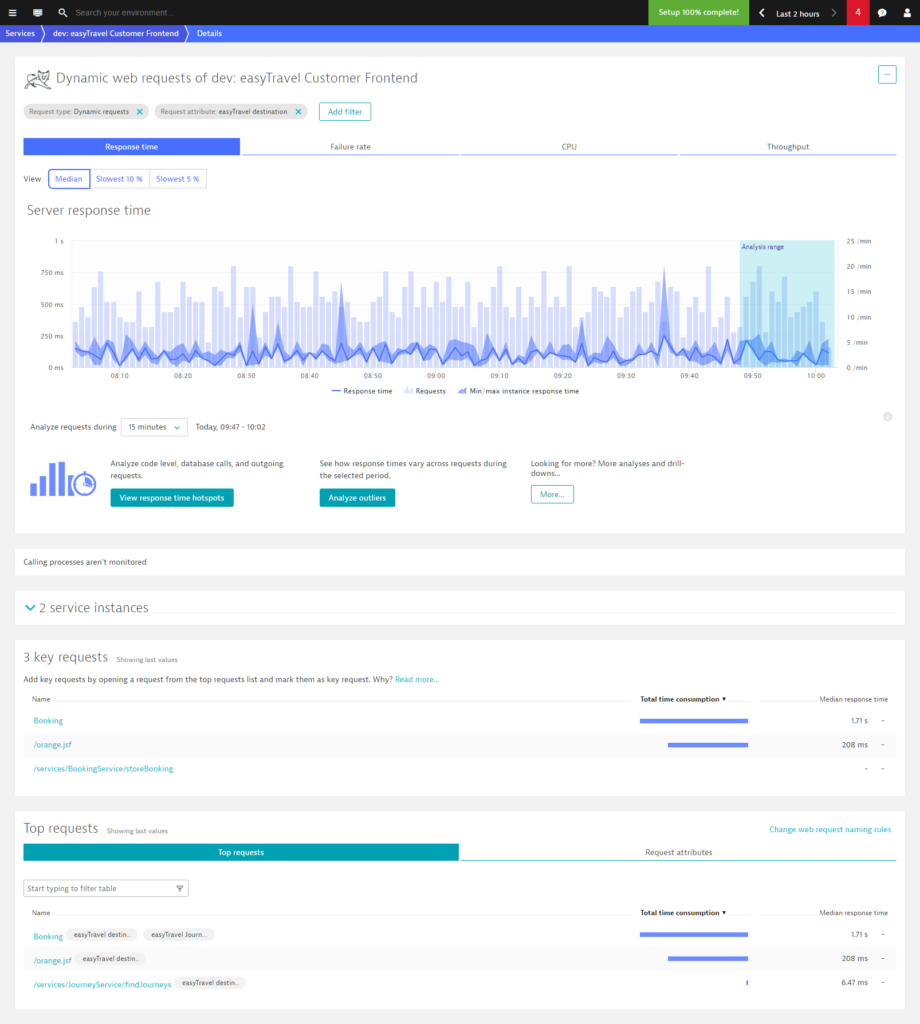
Once you’ve defined your attributes, go to any service page where you expect to see your defined request attributes. Have a look at the Top requests section (see example below). The requests now feature attribute labels indicating that at least some of respective requests contain the new request attribute. Click any request attribute to filter the entire page view down to only those requests that carry the selected attribute.

This includes both the chart at the top of the page and the request table further down the page. Any further analysis you do is likewise focused on these same requests.
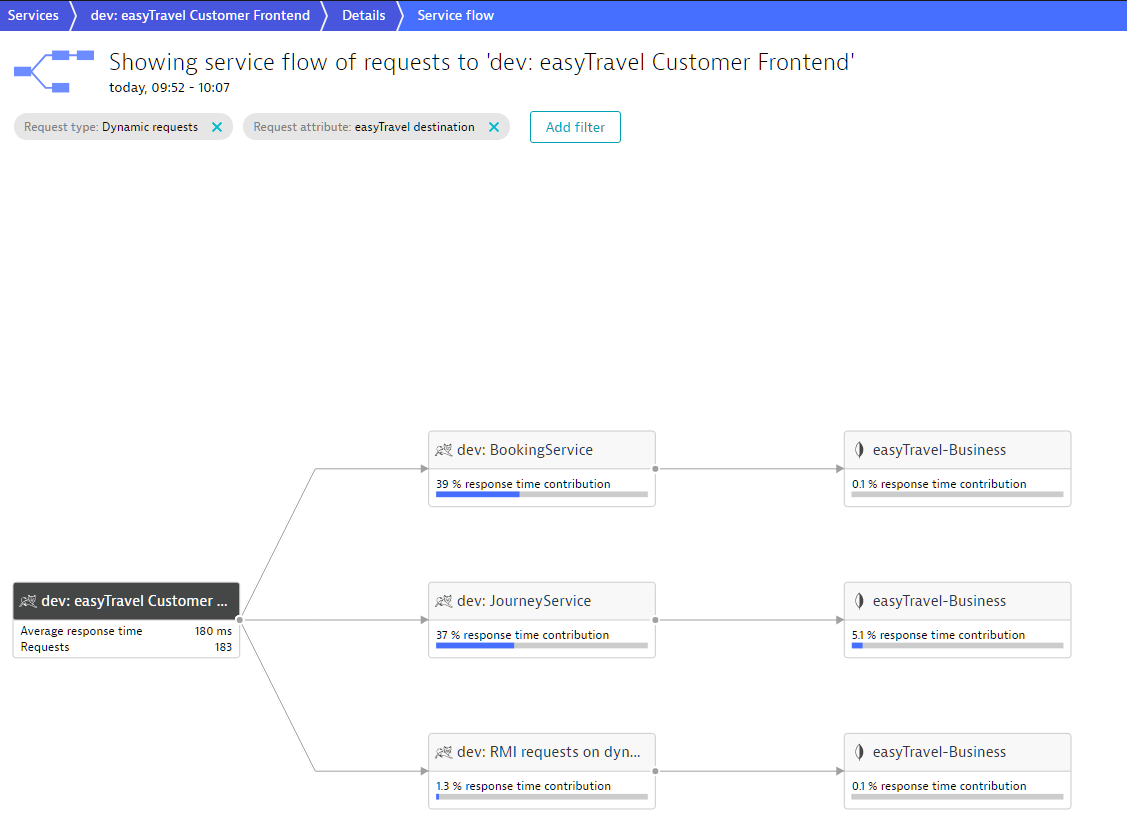
Service flow only shows those requests that contain the easyTravel destination request attribute.
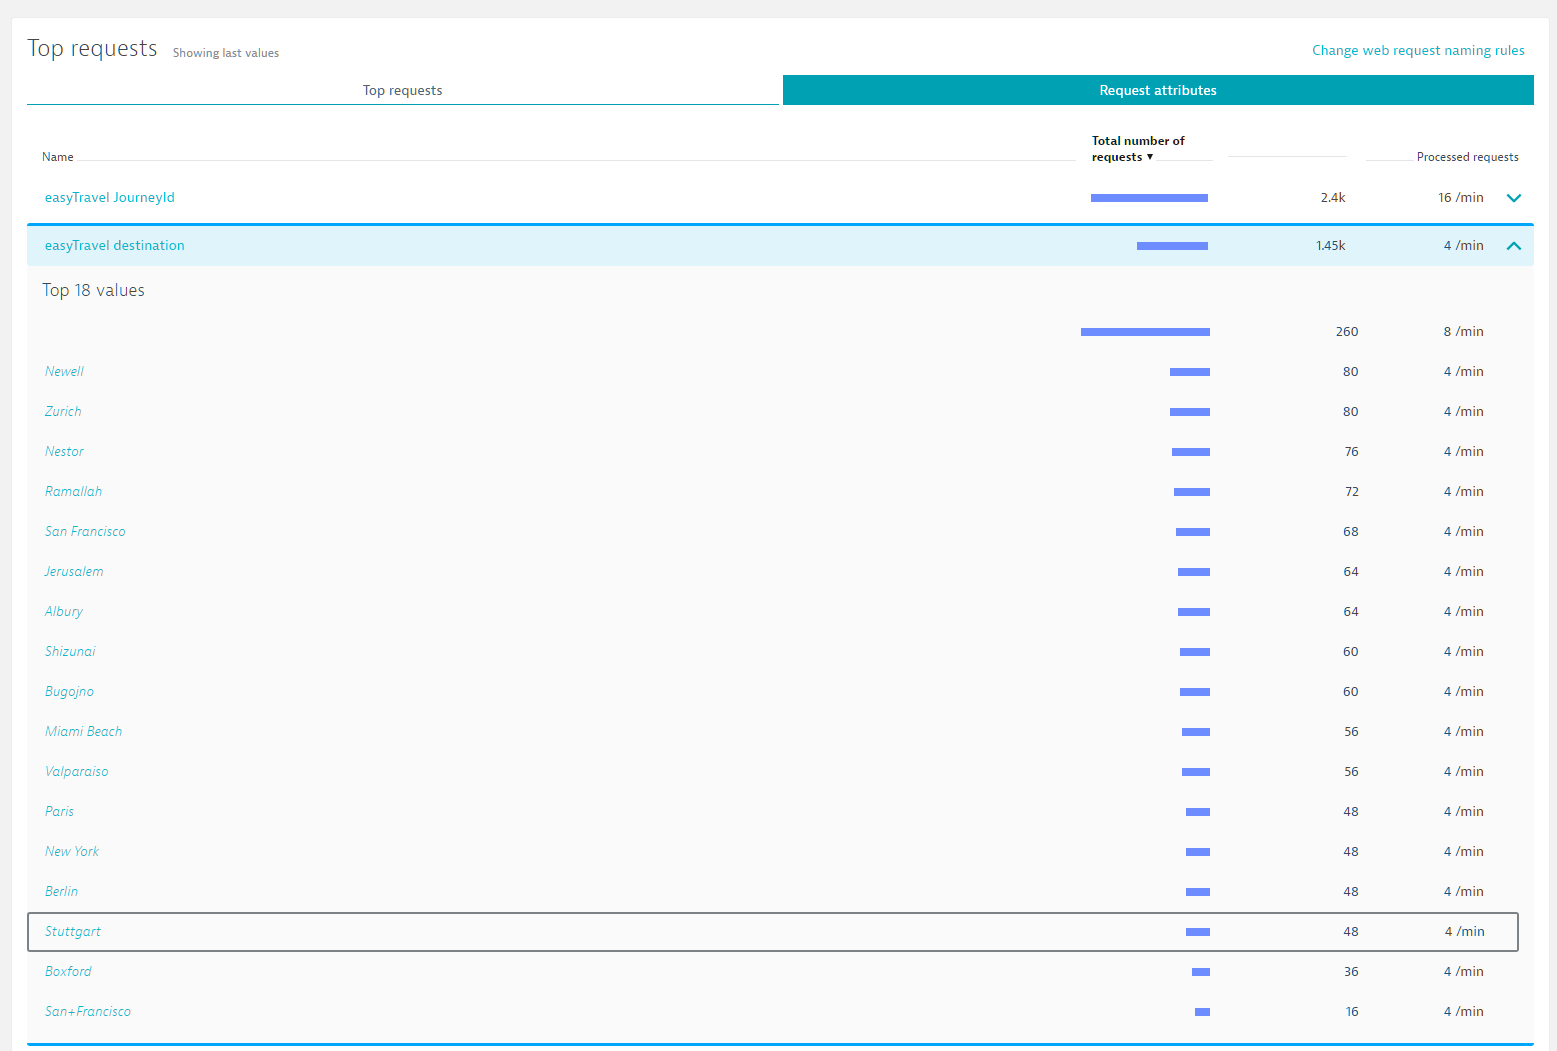
A new Request attributes tab has been added next to the Top requests tab. This tab lists the request attributes that correspond to the request page. This table reflects the current filter settings and shows the same metrics as the request table.
There are four request attributes included in the example below. The Median response time is the median response time of all requests that contain the request attribute. Total time consumption represents the sum of response times of all requests in the selected timeframe that have the selected request attribute.

You can also view the corresponding throughput metrics. In the example below, there were 2,400 requests that dealt with easyTravel JourneyId and the current throughput is 16/min.

Request attributes do of course have values. You can see the values by expanding any attribute row. The table below shows the throughput numbers for all requests that contain the easyTravel destination attribute, broken out into the Top 18 values.
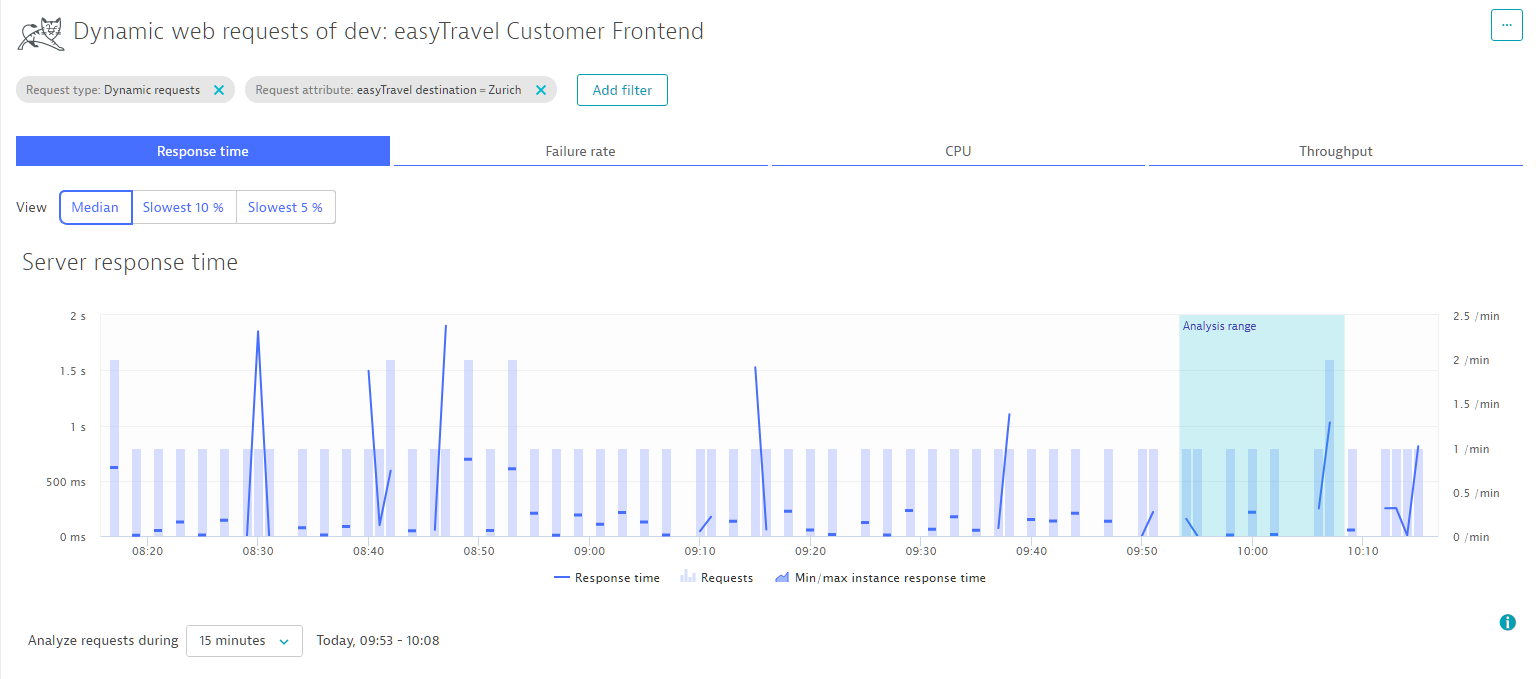
Here again, click any request attribute key/value pair to narrow down the results on the page to just those requests that include the selected attribute value. For example, the chart below only shows those requests that have the attribute key/value pair easyTravel destination = Zurich.
Request attributes in service analysis
Request attributes can be leveraged across all service analysis views. The service flow below shows the transaction flow of 52 Requests. 73% of the requests make about 10 calls to JourneyService. The service flow is filtered with the request attribute key/value pair destination = Berlin. This means that all 52 requests on the easyTravel Customer frontend service have a request attribute destination with the value Berlin!
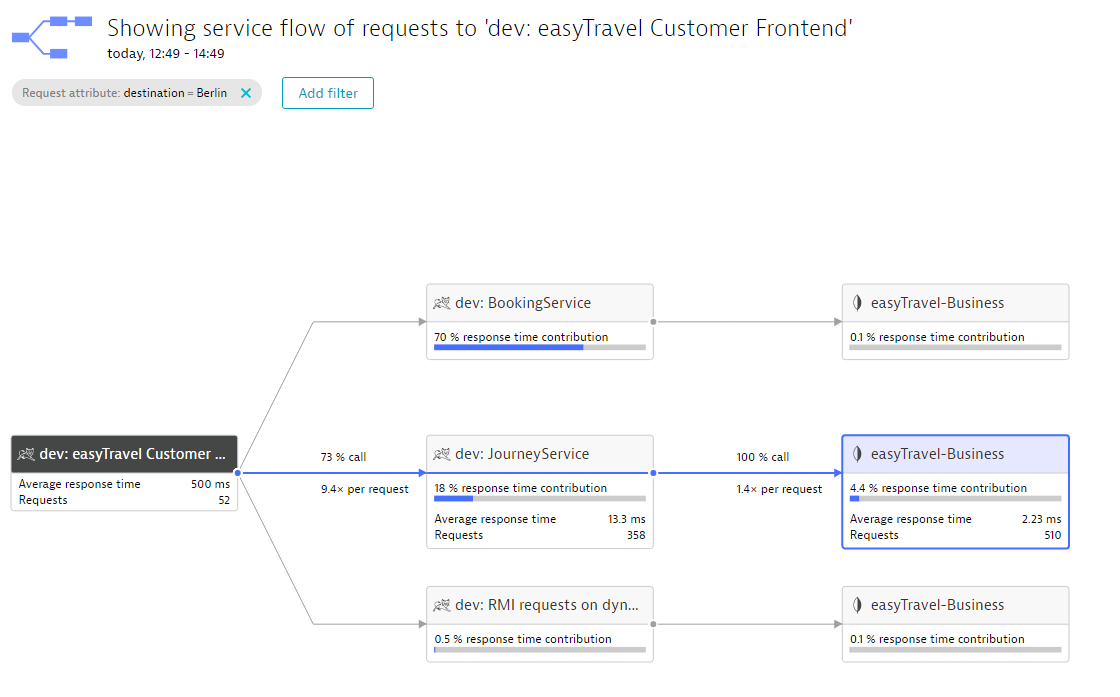
We can add additional filters on JourneyService for other attributes that exist on these requests. The following service flow only shows requests that have the attribute destination = Berlin on the easyTravel Customer Frontend request and also make POST requests to the Journey Service.
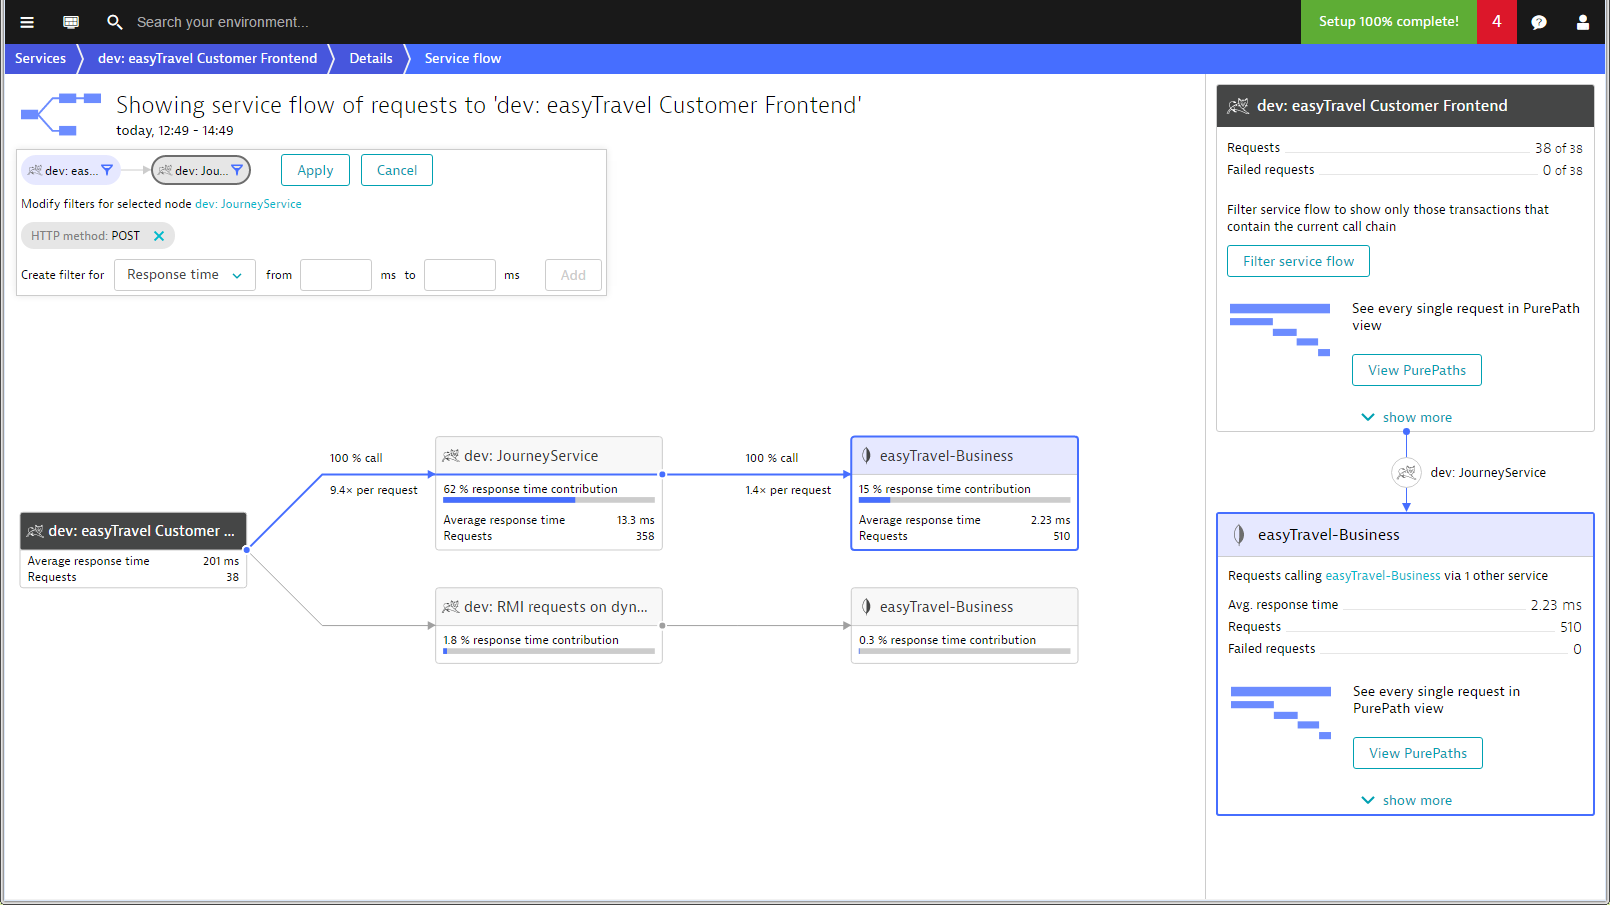
This filtering approach works across all levels of all service analysis views.
Protect confidential attribute values
Because request attributes can include confidential values, Dynatrace makes it possible to hide sensitive data from certain user groups and restrict who can define the data items that are captured within request attributes. To define or edit a request attribute, users must have the Configure capture of sensitive data permission.
If you select the Request attribute contains confidential data check box (see below), only users who have the View sensitive request data permission will be able to see the values of the attribute and use the attribute as a filter. The attribute values are hidden from all other users.

The request attribute table still indicates to unauthorized users that the attribute exists and provides overall request numbers, but the values are hidden (see example below).

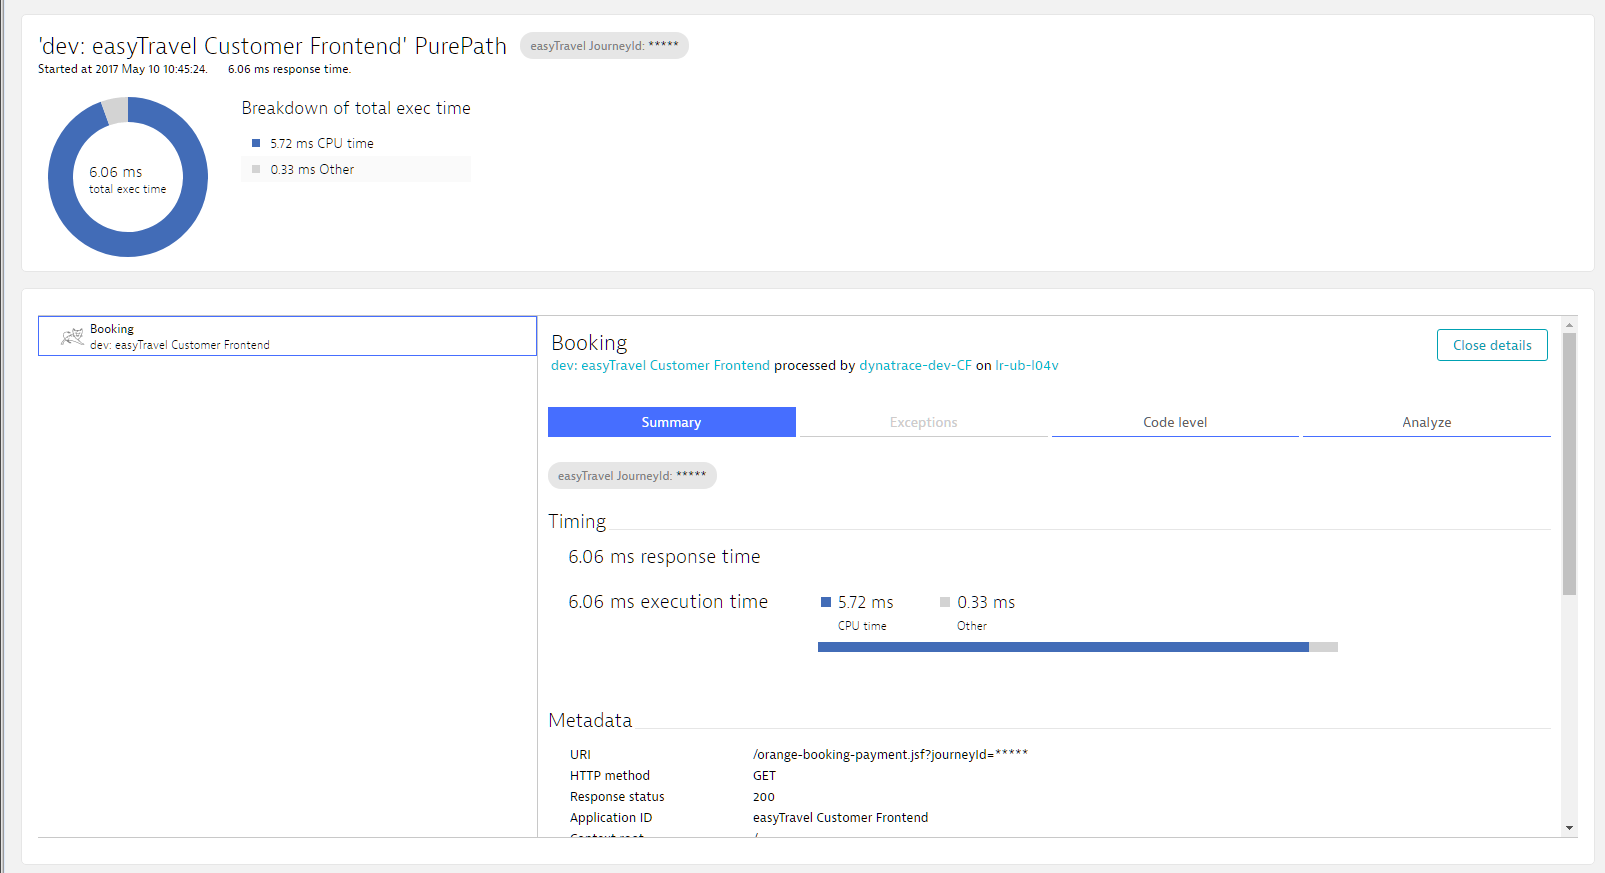
Looking at the PurePath, you can see that the actual JourneyId is hidden because this user doesn’t have permission to view confidential data.
What’s next?
At the moment, we only allow the capture of web request headers and parameters. Soon we’ll extend the functionality to make it even more versatile. We also plan to further expand the use of request attributes across Dynatrace. So, please stay tuned.
Start a free trial!
Dynatrace is free to use for 15 days! The trial stops automatically, no credit card is required. Just enter your email address, choose your cloud location and install our agent.


Looking for answers?
Start a new discussion or ask for help in our Q&A forum.
Go to forum