Reducing Garbage-Collection Pause Time
Chapter: Memory Management

There are two general ways to reduce garbage-collection pause time and the impact it has on application performance:
- The garbage collection can itself can leverage the existence of multiple CPUs and be executed in parallel. Although the application threads remain fully suspended during this time, the garbage collection can be done in a fraction of the time, effectively reducing the suspension time.
- The second approach is leave the application running, and execute garbage collection concurrently with the application execution.
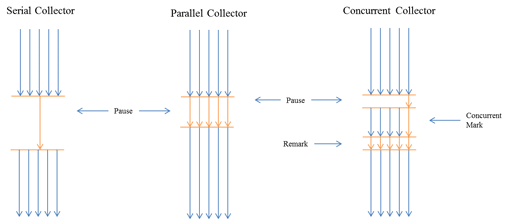
These two logical solutions have led to the development of serial, parallel, and concurrent garbage-collection strategies, which represent the foundation of all existing Java garbage-collection implementations (see Figure 2.6).

The serial collector suspends the application and executes the mark-and-sweep algorithm in a single thread. It is the simplest and oldest form of garbage collection in Java and is still the default in the Oracle HotSpot JVM.
The parallel collector uses multiple threads to do its work. It can therefore decrease the GC pause time by leveraging multiple CPUs. It is often the best choice for throughput applications.
The concurrent collector does the majority of its work concurrent with the application execution. It has to suspend the application for only very short amounts of time. This has a big benefit for response-time—sensitive applications, but is not without drawbacks.
(Mostly) Concurrent Marking and Sweeping
Concurrent garbage-collection strategies complicate the relatively simple mark-and-sweep algorithm a bit. The mark phase is usually sub-divided into some variant of the following:
- In the initial marking, the GC root objects are marked as alive. During this phase, all threads of the application are suspended.
- During concurrent marking, the marked root objects are traversed and all reachable objects are marked. This phase is fully concurrent with application execution, so all application threads are active and can even allocate new objects. For this reason there might be another phase that marks objects that have been allocated during the concurrent marking. This is sometimes referred to as pre-cleaning and is still done concurrent to the application execution.
- In the final marking, all threads are suspended and all remaining newly allocated objects are marked as alive. This is indicated in Figure 2.6 by the re-mark label.
The concurrent mark works mostly, but not completely, without pausing the application. The tradeoff is a more complex algorithm and an additional phase that is not necessary in a normal stop-the-world GC: the final marking.
The Oracle JRockit JVM improves this algorithm with the help of a keep area, which, if you're interested, is described in detail in the JRockit documentation. New objects are kept separately and not considered garbage during the first GC. This eliminates the need for a final marking or re-mark.
In the sweep phase of the CMS, all memory areas not occupied by marked objects are found and added to the free list. In other words, the objects are swept by the GC. This phase can run at least partially concurrent to the application. For instance, JRockit divides the heap into two areas of equal size and sweeps one then the other. During this phase, no threads are stopped, but allocations take place only in the area that is not actively being swept.
The downsides of the CMS algorithm can be quickly identified:
- As the marking phase is concurrent to the application's execution, the space allocated for objects can surpass the capacity of the CMS, leading to an allocation error.
- The free lists immediately lead to memory fragmentation and all this entails.
- The algorithm is more complicated than the other two and consequently requires more CPU cycles.
- The algorithm requires more fine tuning and has more configuration options than the other approaches.
These disadvantages aside, the CMS will nearly always lead to greater predictability and better application response time.
Reducing the Impact of Compacting
Modern garbage collectors execute their compacting processes in parallel, leveraging multiple CPUs. Nevertheless, nearly all of them have to suspend the application during this process. JVMs with several gigabytes of memory can be suspended for several seconds or more. To work around this, the various JVMs each implements a set of parameters that can be used to compact memory in smaller, incremental steps instead of as a single big block. The parameters are as follows:
- Compacting is executed not for every GC cycle, but only once a certain level of fragmentation is reached (e.g., if more than 50% of the free memory is not continuous).
- One can configure a target fragmentation. Instead of compacting everything, the garbage collector compacts only until a designated percentage of the free memory is available as a continuous block.
This works, but the optimization process is tedious, involves a lot of testing, and needs to be done again and again for every application to achieve optimum results.
Table of Contents
Application Performance Concepts
Memory Management
How Java Garbage Collection Works
The Impact of Garbage Collection on application performance
Reducing Garbage Collection Pause time
Making Garbage Collection faster
Not all JVMS are created equal
Analyzing the Performance impact of Memory Utilization and Garbage Collection
The different kinds of Java memory leaks and how to analyze them
High Memory utilization and their root causes
Classloader-releated Memory Issues
Performance Engineering
Virtualization and Cloud Performance
Try it free
