This post is the third and final installment in our OpenStack monitoring series. Part 1 explores the state of OpenStack and some of its key terms, Part 2 is about the OpenStack monitoring space and how open source tools like the Elastic Stack (ELK Stack) compare to Dynatrace.
In this last part let’s take a closer look at how Dynatrace monitors OpenStack.
Since we started our journey with OpenStack, we had a lot of interesting conversations with OpenStack cloud users. As a general conclusion, we learned that the most important metrics and capabilities they are looking for include:
- OpenStack service performance
- Service availability
- Resource utilization metrics
- Log monitoring
However, what we also learned is that OpenStack is a different kind of beast: due to its elusive nature, problems with one OpenStack service can manifest themselves as performance issues within other services.
Take this example: an OpenStack admin notices an issue when launching a new VM or attaching a Cinder volume. His first thought might be to look into the log files of Nova and Cinder services. After combing through hundreds of megabytes of log data, he might learn however that the root cause of the issue resides within different OpenStack services, or supporting technologies like load balancers (HAproxy), message brokers (RabbitMQ), and databases (MySQL).
That’s why it’s so important to look at your OpenStack environment holistically, as opposed to the single monitoring use cases that traditional monitoring tools provide. You need to cover:
- OpenStack service performance
- Service availability
- Supporting technologies: HAproxy, Rabbit MQ, MySQL
- Resource utilization metrics
- Log analysis
- APM
- Problem alerting with root cause analysis
Get a perfect overview of OpenStack and everything running on it in six easy steps with Dynatrace
1. Install a single agent
To start monitoring your OpenStack components the only thing you need to do is install the Dynatrace agent on all controller nodes that run OpenStack API services. Once it’s done, you can easily add the dedicated OpenStack monitoring tile to your Dynatrace dashboard.
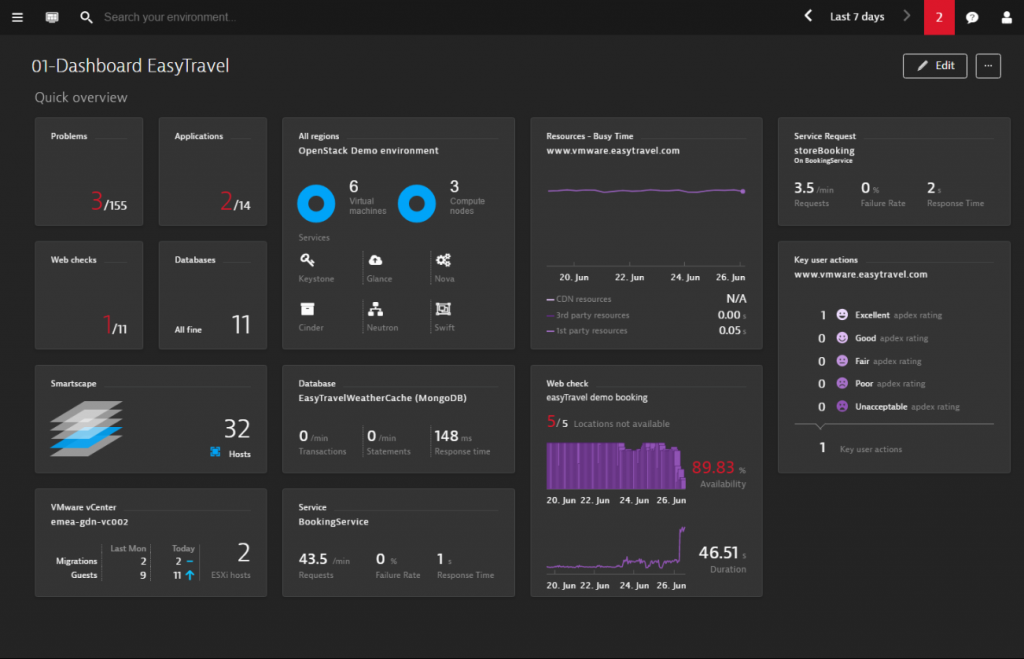
But there is another important thing happening upon installation: with zero configuration, Dynatrace application mapping auto-detects and creates an interactive visualization of your entire application topology from your OpenStack cloud components up to the application front end.
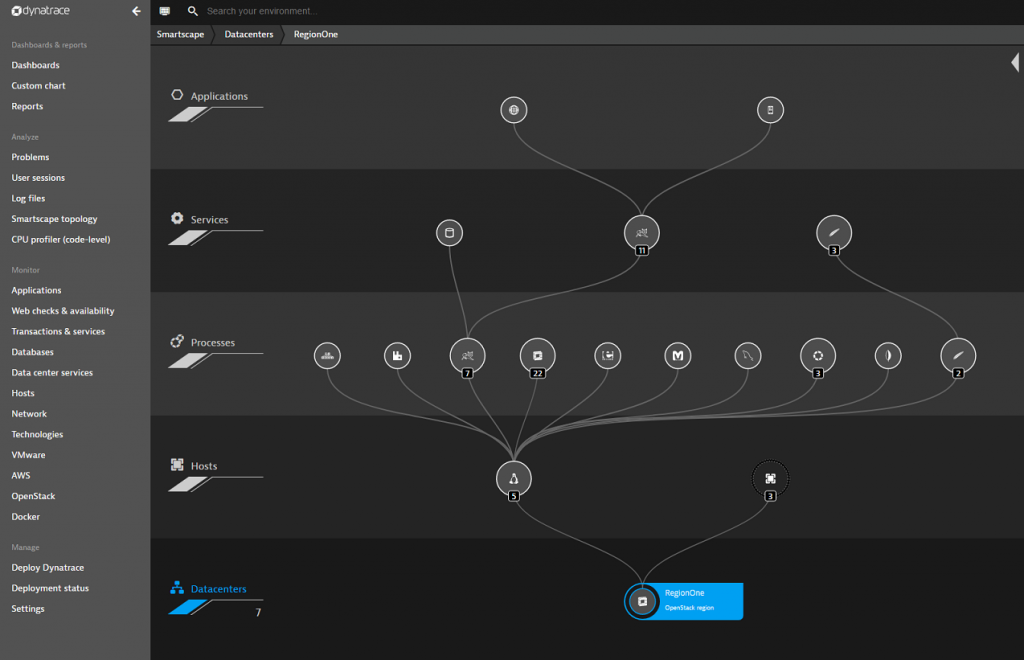
This is the perfect starting point for you to drill down into your OpenStack data plane and see what’s going on.
2. Analyze your OpenStack compute nodes
In the Compute view you get a general overview of your controller and compute nodes, your Cinder volumes, Neutron subnets and your Swift objects. But keep scrolling because more valuable insights are coming.
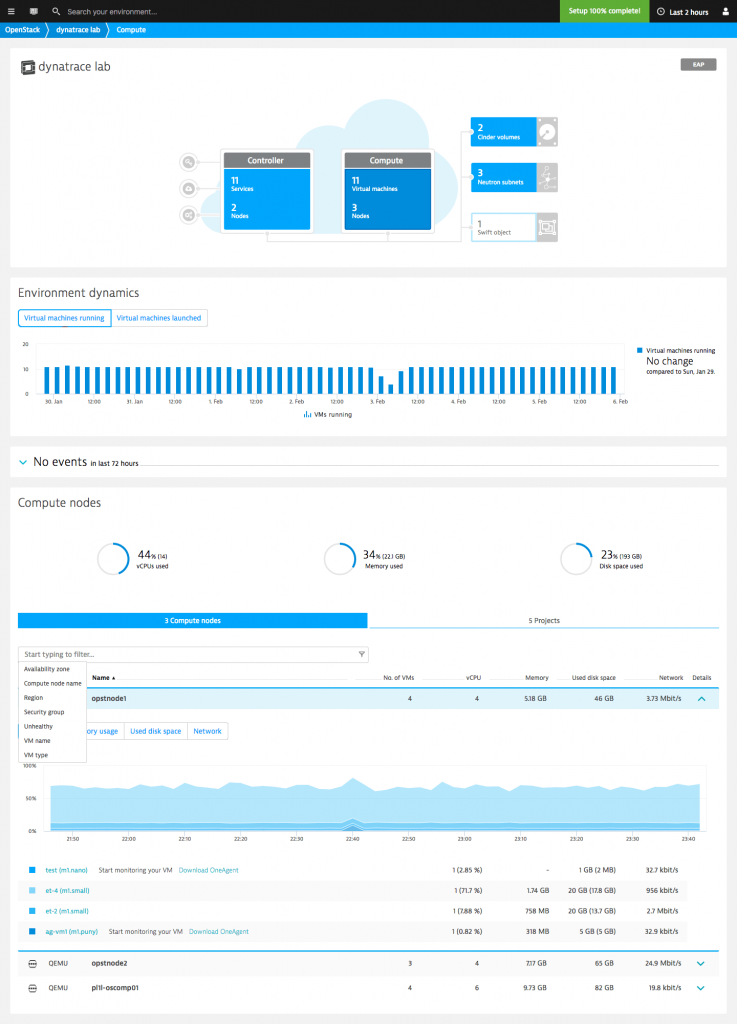
The Environment dynamics section tracks how the number of running virtual machines evolves over time. An increasing trend may indicate the need for capacity adjustments. Crucial details regarding the number of VMs that have been spawned and their average launch times is also included. If you notice launch times going up, you may want to investigate the reasons why.
The Events section lets you know on which compute node each VM is launched and stopped.
The Compute section shows you how well your compute nodes are performing, which virtual machines are currently running on those nodes, and how the VMs contribute to overall resource usage.
You can slice and dice your OpenStack monitoring data with filters—compute nodes and virtual machines can be filtered based on region, security group name, compute node name, availability zone, and more. Such filtering is particularly useful for tracking down elusive performance issues within large environments.
3. Gain insights into your OpenStack controller node
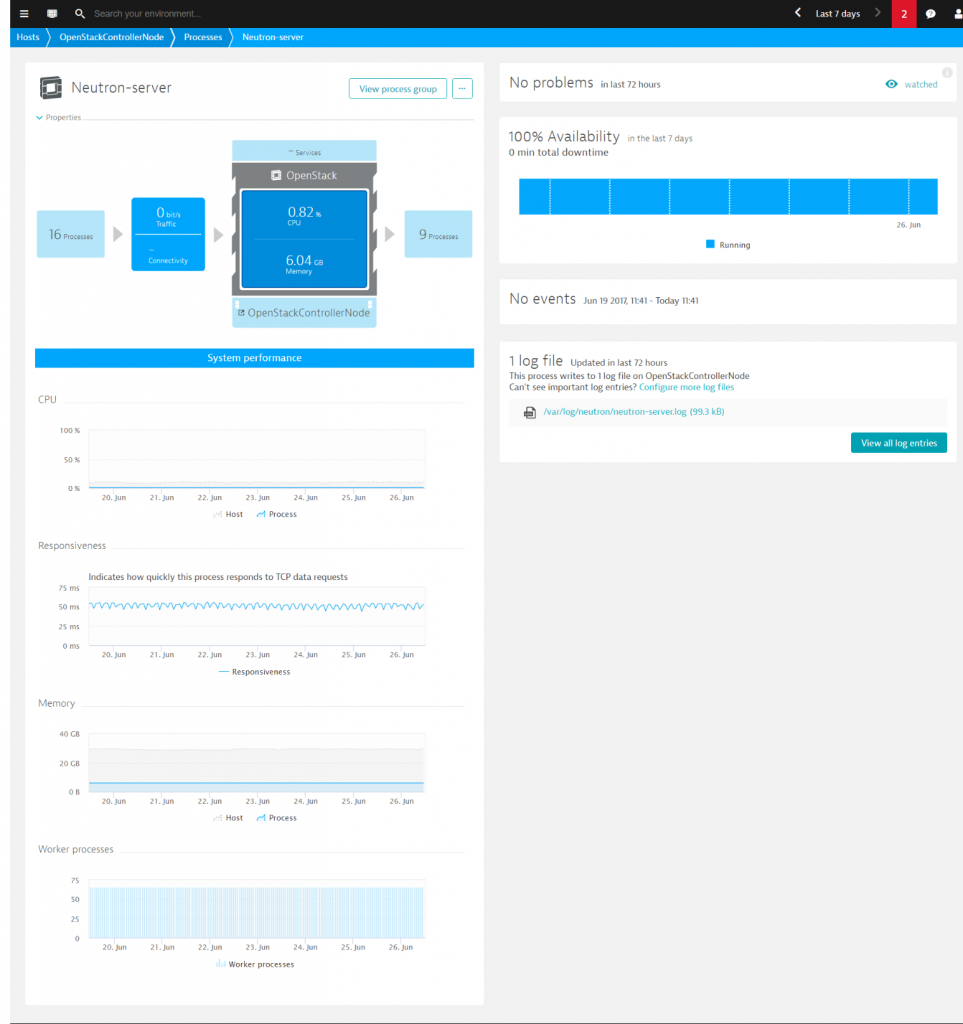
If you switch to the Controller section, you get a complete overview of your OpenStack services (Keystone, Glance, Cinder, Neutron and others) and their basic performance metrics like CPU, Memory usage, Connectivity.
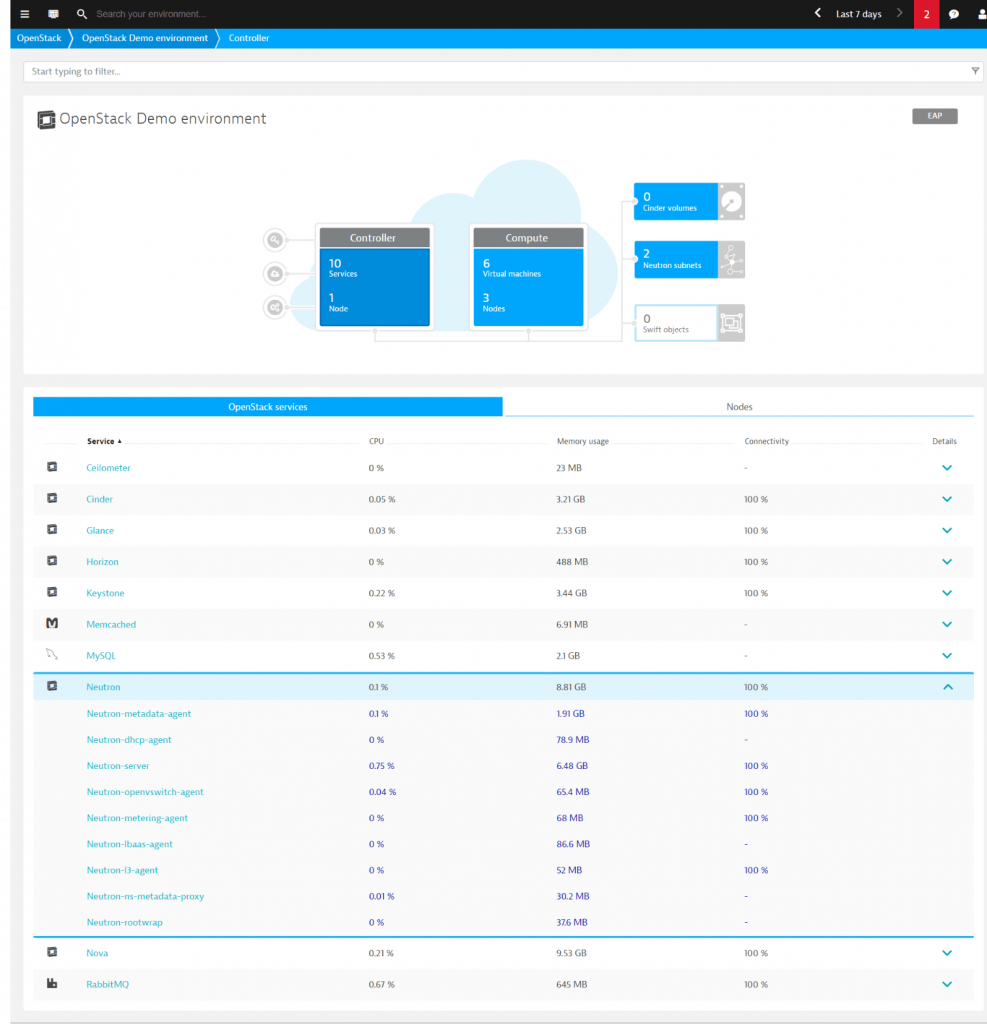
From here you can select the service you are interested in and drill down into it on a process page to find out more about its performance. Here, Dynatrace provides:
- OpenStack service availability
- Service performance
- Connectivity
- Process-specific metrics
- …and direct access to the log files of all OpenStack services
4. Keep an eye on supporting technologies
The technologies deployed alongside OpenStack — load balancers, message brokers and databases — are often potential problem areas about which OpenStack admins need to be aware. Take this RabbitMQ connectivity problem for example.
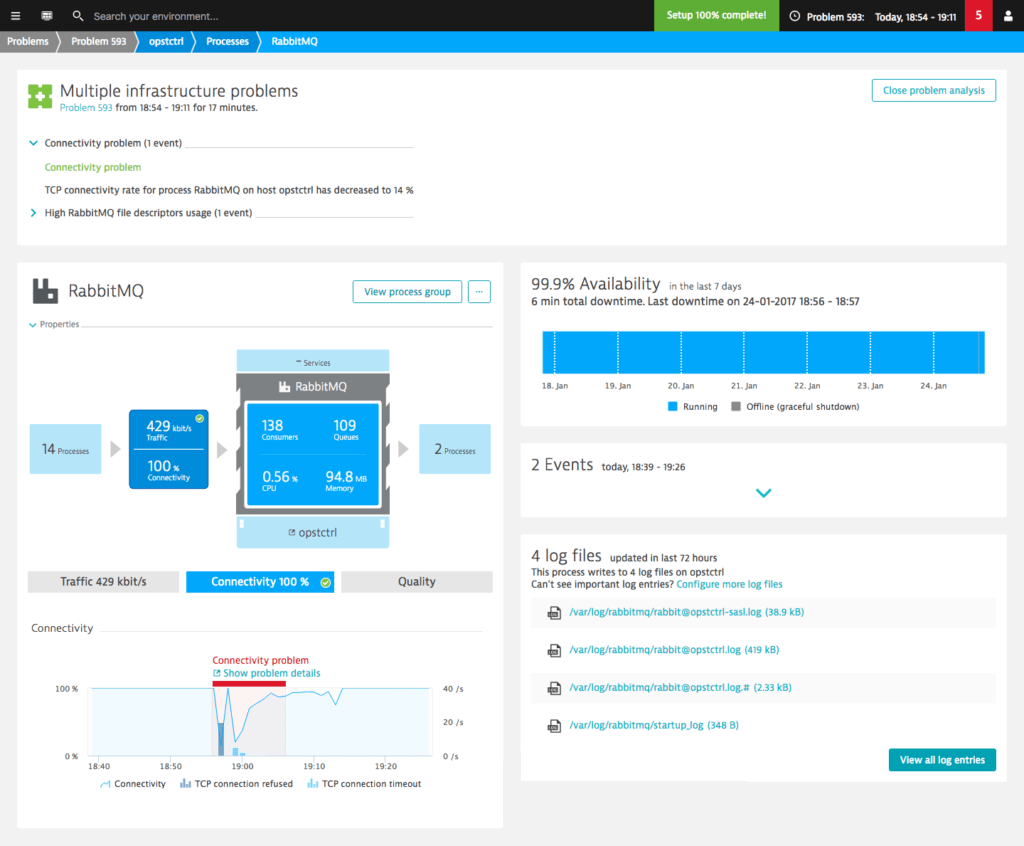
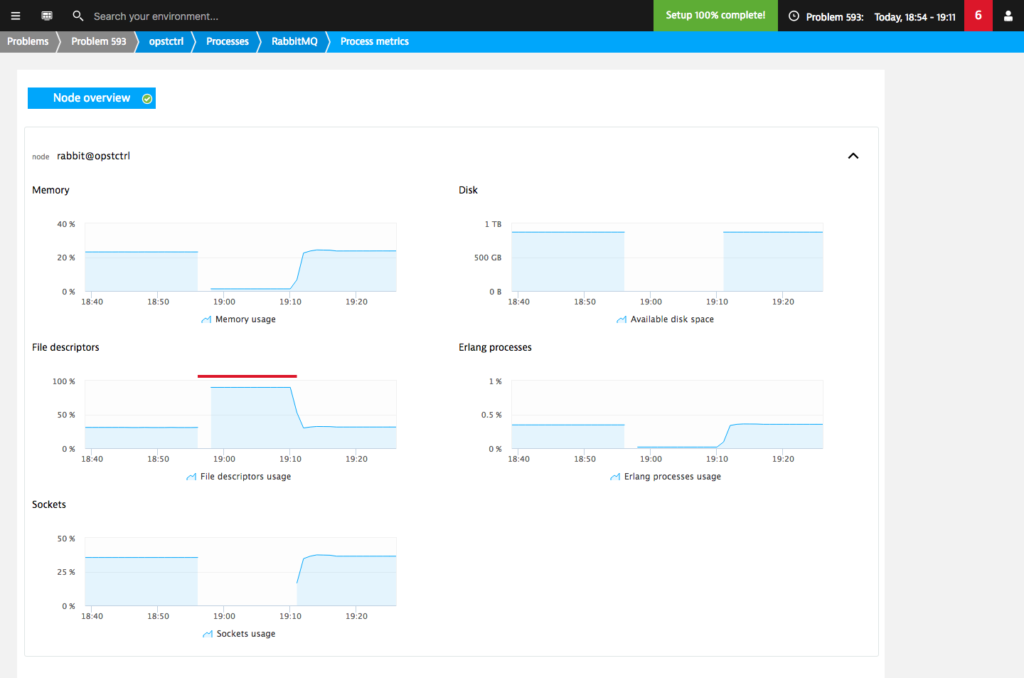
Thanks to the additional RabbitMQ counters provided by Dynatrace we can easily find the root cause.
On the Further details section of the RabbitMQ process page we can see that this process was launched with a default file descriptor limit. Once this limit was exceeded, RabbitMQ stopped accepting new connections. This resulted in a connectivity problem.
5. See the overall health of your applications running on OpenStack
In the previous steps we’ve seen how Dynatrace deals with infrastructure level components, like compute nodes and OpenStack services. But if that’s all a monitoring tool gives you, be sure you see only a part of the big picture.
To get the most out of your OpenStack monitoring, you need a way to correlate what’s happening in OpenStack with what’s happening in the rest of your application environment.
Besides providing insights into your OpenStack control plane, Dynatrace also gives deep visibility into the applications you run in your private cloud. By automatically correlating OpenStack events to real user and business metrics, you get an unparalleled insight into your digital business.
Take the example below: this problem notification lets us know that in one of our web applications running on OpenStack the user action duration has seriously degraded.
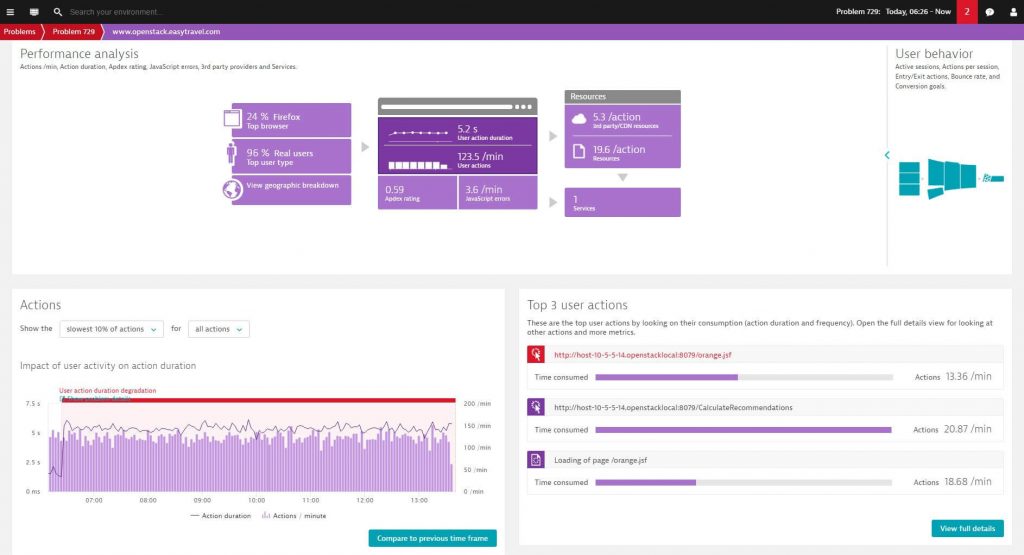
A-ha, so that’s why there were no conversions in the last two hours.
But why?
6. Understand the causes of failing services
If your daily activity involves monitoring, I’m quite sure one of your favorite questions is “but why”. This is where Dynatrace’s automated root cause analysis can come in handy.
While manually hunting down performance problems in highly distributed OpenStack environments can be a time-consuming (if not impossible) process, Dynatrace makes it possible to automatically pinpoint application and infrastructure issues in seconds using artificial intelligence.
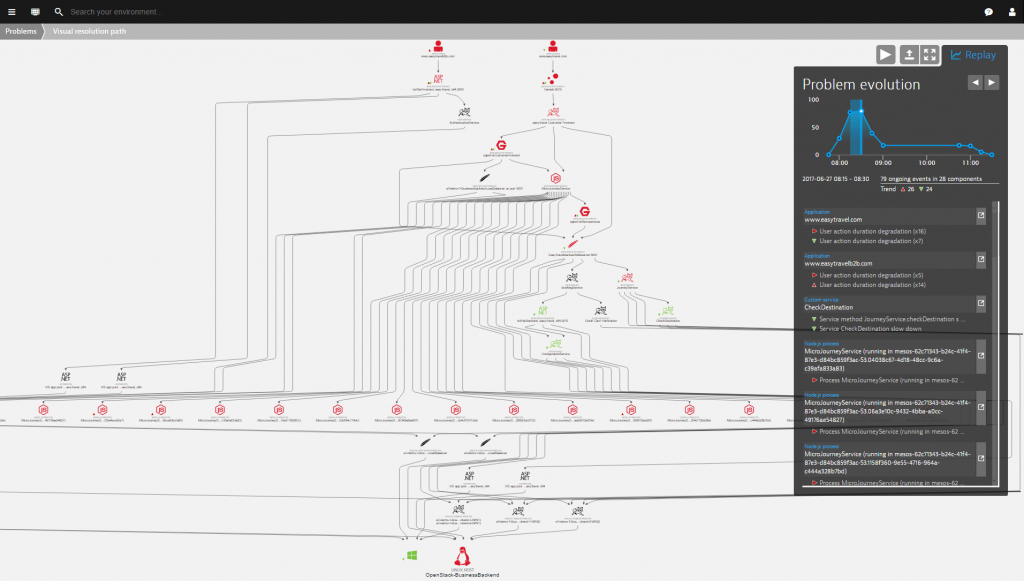
By examining billions of dependencies, Dynatrace problem detection goes beyond correlation and gives you causation. Thus, in the example above it identified that the actual cause of the problem was a CPU saturation on the OpenStack-Business-Backend host. Nice, from here we can start remediating the issue.
So, who will make sure that application performance stays high?
While Gartner called it a “science project” in 2015, in 2017 451 Research Group estimates that:
OpenStack’s ecosystem will grow nearly five-fold in revenue, from US$1.27 billion market size in 2015 to US$5.75 billion by 2020.
It’s not yet seven and OpenStack is really going to eat the world: it already started to turn the e-commerce business upside down. Becoming more mature, OpenStack environments also need app-centric monitoring that is mature enough to handle their complexity.
Open source monitoring tools like the Elastic Stack (ELK Stack) are all being strong in their specific areas. Before choosing anything however, consider what do you need to monitor. It could be only a few things or it could be everything. And then choose the tool that will make your monitoring life easier.
In the first part of this blog series we took a look at the state of OpenStack. Then we made a short journey in the current monitoring space available for OpenStack to see how tools like the ELK Stack compare to Dynatrace. Finally, I attempted to present the Dynatrace way of monitoring OpenStack by showing its specialties – Full stack power, AI-power, and Automation power. Even though these might sound like marketing buzzwords for some, at the moment there is no other monitoring tool capable to see the big picture, understand data in context, and do this without any manual intervention.
If you would like to see Dynatrace at work, take our 15-day free trial or reach out to openstack@dynatrace.com
This series will end now, but stay tuned because soon my colleague Dirk Wallerstorfer is going to unveil some great insights about Dynatrace’s OpenStack monitoring.


Looking for answers?
Start a new discussion or ask for help in our Q&A forum.
Go to forum